
A Disruptive Perspective
The confluence of actuarial science, underwriting, IT and predictive analytics June/July 2018Disruptive technologies make it an exciting and potentially threatening time to be in the life insurance industry. Life insurance underwriting programs are affected by consumer demands for higher efficiencies, less invasive requirements and quicker turnaround times. Integrating new data sources with traditional requirements and utilizing the latest predictive modeling techniques are prerequisites for future success. Building automated underwriting systems that leverage three disciplines—actuaries, underwriters and IT personnel—are worthy endeavors, but, traditionally, these groups typically work in silos rather than collaborating in cross-functional teams. How can we best integrate these vital functions to produce a better product?
It’s not just about doing it better, but faster, all while transforming the customer experience. Today’s technology allows for faster access to more relevant information, which strikes at the core of underwriting data sources. This new data is useful in underwriting the life insurance risk, but how do we integrate it with the existing underwriting process? Further, our customers demand faster decisions with less invasive processing, as illustrated by the success of accelerated underwriting programs. We question whether the traditional underwriting process can survive these disruptive forces.
What happens when the irresistible forces of increased data and shorter decision-making windows meet up with an immovable object, the underwriting process? Conventional underwriting methods are dominated by specialized training and significant judgment that is as much an art as it is a science. It’s possible that, in our quest for automation and speed, we risk losing the traditional benefits of the underwriting process.
We need to meet these challenges with a disruptive underwriting process that combines efforts and shares somewhat disparate, but equally valid, perspectives. The result envisioned is a prioritized underwriting system that focuses on the outcome—life expectancy—instead of the inputs—risk classification. The path created is just one of many possible routes. This article is a description of the general process and goals rather than detailed documentation of each step in the process.
Successful predictive modeling of the life insurance risk requires three knowledge areas: clinical underwriting knowledge, programming knowledge and actuarial knowledge. Clinical underwriting knowledge is critical in collecting input data, sifting through pages of medical records to extract and normalize all the conditions documented for the subjects in the study. Programming knowledge and data organization develop systems to store and validate data the underwriters find. All the conditions and data collected by the underwriters need a home, which is provided by an IT team of database experts and programmers. The underwriters and the IT team work together to develop the triggers that would indicate discrepancies in the medical records, which, if triggered, prompt the underwriter examining the case to further investigate for errors or potential fraud. Actuarial knowledge provides the analytical review of the work completed with underwriting and programming knowledge. While the computers automate calculations, produce stunning visualizations of the data and learn the best-fitting models, the actuaries make sense of it all.
The Data
Data on insured populations is a critically needed asset. The data covers both demographic and health conditions information. Data from other relevant populations, such as the general U.S. population, college-educated subjects and nursing home populations, is needed to measure how the mortality of new populations converge to the mortality of existing populations. The challenge is to define the speed of convergence as a function of age in actuarial modeling.
For data on deaths, we utilize the Social Security Death Master File (SSDMF) and supplement it with obituary search services that help bridge any gaps in the file. This two-stage approach is necessary due to changes in the SSDMF implemented in November 2011, which eliminated approximately 1 million deaths per year from it due to a new interpretation of the law that concluded state death records could not be used as source material for the SSDMF. Life data is supplemented with health data to determine the likelihood an insured has a certain underwriting condition given the existence of a prescription drug and/or ICD codes. For example, if an insured has a prescription drug history that includes Metformin, the odds are overwhelming that he or she suffers from diabetes.
The Process
It is both a blessing and a curse that our key predictive analytics tool, the Cox proportional hazards model, which is used to ascertain risk levels, is ambivalent about the mortality distribution underlying the data. A base mortality table is needed to begin the process. The Cox model can be used to define base mortality tables by gender and smoking status. It is also possible to substitute other tables, but it is important to address disparate results from the use of different tables. (See sidebar for more on the Cox model.)
Cox Proportional Hazard Model
The Cox proportional hazard model was introduced in 1972 as a method to examine the relationship between survival (mortality) and one or more independent variables. Its advantages include the ability to handle data that is right-censored, and it can utilize many underwritings on the same life. It does not require knowledge of the underlying (base) survival curve.
Consistent underwriting guidelines are important in identifying current health state using medical records that contain both quantitative data and subjective information. Cataloging quantitative results, such as A1C levels, eGFR measurements, ICD codes, prescription information, vitals or ejection fractions, is extremely valuable in providing unbiased results as well as determining appropriate thresholds for normalization. Pinpointing the onset of health conditions is crucial to mapping out the longitudinal history needed to understand the increase or decrease in mortality over time.
Traditional underwriting relies on the application of a mortality debit/credit system to place individuals in appropriate risk classes. The new underwriting paradigm accesses data sources and information not previously used in traditional underwriting and not previously available. Using models and sophisticated algorithms to ingest and digest big data allows us to evaluate new attributes about individual risks that may affect their longevity, focusing underwriting efforts on outcomes rather than inputs. Creating impairment-specific mortality allows for more effective risk classification, which results in better pricing and product development. Leveraging underwriting skills is critical in identifying comorbidity and collinearity among conditions to improve life expectancy estimates.
In addition, this outcomes-based underwriting system shares its theoretical underpinnings with essentially all current medical research, allowing for easy incorporation of the latest findings into the underwriting model.
Challenges in the Brave New World
It will not be all smooth sailing using this new, more data-driven approach. Extreme care is needed to properly interpret potential results. Models may not be readily usable for many reasons.
The Five Vs of Big Data
- Volume. The amount of data continues to grow at an exponential rate.
- Velocity. The speed at which data is available can be “real-time.”
- Variety. Due to the many sources from which data is extracted, the data is in many forms.
- Veracity. The reliability of the data is not uniform.
- Value. The resulting contribution of the data to an application can be in a range from highly negative to extremely positive, and all points in between.
One reason could be that independent variables may not be truly independent; they may be correlated, confounding the results. For example, a variable that indicates the presence of coronary artery disease is highly correlated to others indicating stenosis of the coronary arteries (see Figure 1). When this happens, the Cox model is unable to properly assign risk to each variable and produces spurious results. (Please see Granieri’s article, “Predicting Modeling Techniques—A Case Study in Resolving Correlated Explanatory Variables,” in the June 2017 Predictive Analytics and Futurism Section Newsletter, for a more detailed discussion of this topic.) The models replicate known relationships with a high degree of accuracy. They accurately associate shortened life expectancies with smoking and indicate a lengthening of life expectancies with exercise. The value of the models and algorithms is in detecting associations in big data that were not previously known. For example, most people know that being overweight is bad for one’s health, but what many don’t realize is that being 10 points below the ideal body mass index (BMI) is worse than being 10 points above the ideal BMI, a result detected using machine learning (see Figure 2).
Figure 1: Positive Correlation Among Potential Explanatory Variables
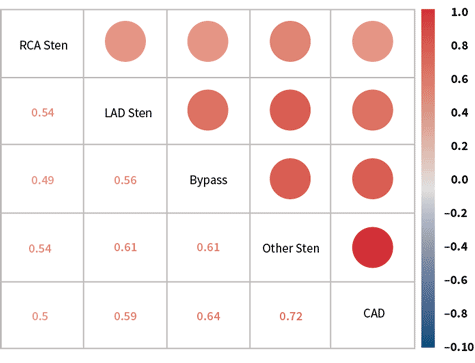
Source: Compiled from research conducted by Predictive Resources LLC.
Figure 2: Mortality Risk Associated With Body Mass Index
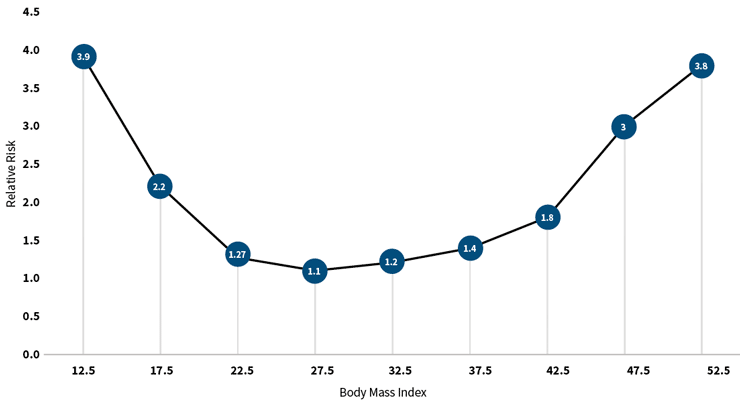
Source: Compiled from research conducted by Predictive Resources LLC.
A second reason is some results may run counter to intuition and require more inspection before adoption. For example, a result that finds someone with a family history of cancer slightly longer in life expectancy than someone with no family history of cancer, all else being equal. It is up to all three disciplines (actuarial, underwriting and IT) to determine if these results are legitimate from their perspective.
Conclusion
In summary, the new data-driven predictive underwriting paradigm provides the greatest opportunity to thrive in an industry that is affected by some of the same forces that are disruptive in many others. Underwriters, actuaries and IT specialists using predictive modeling tools can join forces in a new and better alliance. As for the challenges that remain, let the words of Loren Eisely be our guide to an improved future in underwriting risks: “The journey is difficult, immense, at times impossible, yet that will not deter some of us from attempting it.”