
The Waiting Game … Over?
The joy of being a U.S. life insurer in a low interest rate environment February/March 2016The fun began in August 2011 when the Federal Open Market Committee (FOMC) made an unprecedented announcement that it would be holding the federal funds rate at essentially zero through mid-2013. It further piled on the “good news” in September 2011, announcing “Operation Twist,” a program intended to pull down longer-term interest rates through purchases of longer-dated Treasurys, up to 30-year issues. In addition, the FOMC announced plans to reinvest principal payments made from agency debt and agency mortgage-backed securities (MBS) back into MBS. That squeezed yield for those assets.
As a result of these decisions, Treasury rates dropped and reached historic lows for all maturities in 2012. In May 2013, the Federal Reserve announced it would be tapering back the bond-buying program; the “taper tantrum” ensued, a short-lived bump in interest rates in the last half of 2013. In 2014, rates decreased again, and in 2015, rate movement seemed more sideways.
As with Lucy van Pelt taunting Charlie Brown with a football, each meeting of the FOMC in 2015 brought the opportunity for the committee to decide to raise rates, but we kept hearing “not just yet.”
Finally, though, on Dec. 16, 2015, the FOMC moved the target range for the federal funds rate up 25 basis points (bps). It also projected four similar increases to come in 2016.
Does that mean the waiting game for higher rates is finally over? Over the past five years, the U.S. life insurance industry has been feeling the effects of the low interest rate policy especially hard, along with others heavily dependent on fixed-income securities. (See Figure 1.) The industry had been hoping for a “return to normalcy” after a long run of low rates, but it is not clear even with the recent move by the FOMC whether this normalcy will come anytime soon.
Figure 1: Constant Maturity Treasury Rates
Source: Federal Reserve Bank of St. Louis
Ghosts of Crises Past
The specter of Japan’s experience hangs over the U.S. life insurance industry. In Japan, an official regime of very low interest rates started in the early 1990s, and the rates there are still low. Japanese real interest rates occasionally became negative as inflation outstripped nominal rates. Several Japanese life insurers went insolvent due to overgenerous minimum crediting rates on popular savings products that could not be adjusted. In this long, dry period, Japanese insurers learned the harsh lesson of the results of asset and liability mismatch. They took a closer look at the risks inherent in their portfolios, adjusting accordingly to the extent possible.
Likewise, U.S. life insurers have seen strain as their overall portfolio rates have decreased for more than a decade. (See Figure 2.) The U.S. life industry (including fraternals) showed a net investment yield decrease of more than two full percentage points from 7.02 percent in 2000, down to 4.58 percent in 2014.
Figure 2: General Account Net Investment Yields
U.S. life, annuity and health insurers, including fraternals
Source: A.M. Best, Conning Research & Consulting analysis
This did not represent a steady decrease. Indeed, from 2004 to 2007, the industry seemingly defied the gravity of the low—and decreasing—interest rates over this period. Net investment yields increased from 5.48 percent in 2004 to 5.68 percent in 2007. What was happening? A run to the very assets whose siren song was luring institutional investors across the United States and the world: structured securities engineered to have particular credit rating profiles.
Insurers, seeking yield, invested more heavily in these assets, generally taking the highest-rated tranches. From 2004 to 2007, it seemed the bond portfolio was improving in credit quality due to this investment strategy shift. Bonds in the highest National Association of Insurance Commissioners (NAIC) credit risk rating (NAIC Class 1, covering bonds rated A to AAA) went from 63 percent of the bond portfolio in 2003 up to 69 percent of the portfolio in 2007.
However, in 2008, the risk hidden by these rosy credit ratings became apparent to all in the credit meltdown. U.S. life insurers decreased fairly rapidly in the aftermath of the credit crisis, dropping 31 bps between 2007 and 2008, and 26 bps between 2008 and 2009. Part of this decrease was due to impairments on the once- favored structured securities, and also the rush to cash and Treasurys in reaction to these losses. These decreases have slowed since 2010, as U.S. insurers have reduced their relative positions in cash and Treasurys after having rebuilt capital.
Hopefully insurers have learned that blindly chasing yield, without regard to hidden risks, may cause a similar hit to insurers’ balance sheets. However, the re-risking of the asset portfolios has shown some convergent strategies yet again.
Reaching For Yield through Credit Risk
As experience has shown that credit ratings were not indicative of the hidden risk in structured securities in life insurers’ portfolios, we need another way to see if we can compare the U.S. life industry investments pre- and post-crisis.
The 10-year Treasury rate is a good proxy for life insurers’ investment results, as life insurer bond portfolios, the overwhelming constituent of General Account assets, have had an average maturity of about 10 years for more than a decade. However, the spot 10-year rate is not completely appropriate as a reference rate, as insurers have a mix of assets bought over time with cash flows being reinvested at current rates as older issues mature. Given that, a moving 10-year average of the 10-year Treasury rate was used as a reference rate instead of a spot rate, as shown in Figure 3.
Figure 3: Gross Book Yields and Risk-free Rates (as Percent of Underlying Investable Assets)
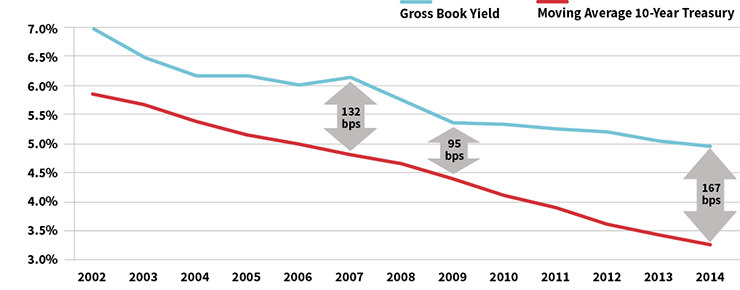
Source: A.M. Best, U.S. Treasury Department, Conning Research & Consulting analysis
In addition, the gross book yield was investigated to remove the effects of expenses on net yield and was measured against “investable assets,” which excludes items such as owner-occupied real estate, derivatives used for hedging purposes, and debt or equity in parents/subsidiaries/affiliates. The point is to try to get at the result from purely investment decisions in the industry.
When the life/annuity industry’s gross book yield is compared against this reference rate, an interesting pattern emerges. During the period from 2005 to 2007 immediately preceding the financial crisis, the gross book yield for the industry increased while the reference rate decreased. As a result, one sees an increasing spread that reaches a wide point of 132 bps in 2007. This spread against the reference rate was increasing as the weighted average credit quality of the bond portfolio was improving (when measured by NAIC credit risk categories). However, this increasing spread uncovers the extra risk being taken on in the industry.
In the aftermath of the crisis, insurers shed many of these assets and built up their cash positions, which is reflected in the low spread of 95 bps in 2009. Since 2009, this spread between the industry book yield and the reference rate has widened each year, possibly reflecting increased risk in the portfolio. The spread between the industry gross book yield on investable assets and the reference rate reached 167 in 2014, surpassing the prior maximum of 132 bps in 2007. Of course, even with this widening spread, gross book yields have been decreasing. The gross book yield on investable assets decreased to 4.98 percent in 2014, compared to 5.06 percent in 2013 and 6.16 percent in 2007.
Unlike the run-up to 2008, the average credit quality of bonds has been worsening in recent years. Some of this has been due to downgrades of bonds already in the General Account, but this impact was seen mostly over 2008 and 2009. Allocations to below-investment-grade bonds increased over those years due to downgrades, but since 2009, the industry overall has reduced the percentage of the bond portfolio in below investment grade.
The most notable credit quality shift has been one of increasing allocation to NAIC Class 2 bonds, or BBB/Baa-rated, as opposed to higher-rated bonds. (See Figure 4.) While this is, again, partly due to downgrades, it is also partly due to what is available in the bond market and other shifts in allocation choices in bond maturity.
Figure 4: Credit Quality of Bond Portfolio
Source: A.M. Best, Conning Research & Consulting analysis
Insurers have a limited number of corporate bonds available to select among longer maturities. For example, the Vanguard Long-Term Corporate Bond Exchange-Traded Fund, intended to track the Barclays Capital Long Corporate Index, as of Sept. 30, 2015, was composed of 1,653 bonds with an average duration of 13.5 years and maturity of 23.9 years, with almost 9 percent of that portfolio rated Aa or higher. About 49 percent of this fund is rated Baa, equivalent to NAIC Class 2.
This mirrors the shift to NAIC Class 2 bonds in the life/annuity industry portfolio. In 2007, NAIC Class 2 bonds made up 25 percent of the industry’s bond portfolio; by 2014, they made up 31 percent of the portfolio. This increase to NAIC Class 2 bonds came at the expense of NAIC Class 1 bonds (credit rating A to AAA), which dropped from 69 percent of the bond portfolio in 2007 to 63 percent in 2014.
The most noteworthy feature of these asset allocation shifts is that they have been industrywide. In Conning’s research of U.S. insurer investment trends, some trends have been driven almost exclusively by the largest insurers. This is not the case with the credit shifts: From the smallest to the largest insurers, there has been a noticeable increase in allocations to lower-rated bonds. There even has been a shift from AAA/AA-rated bonds down to A-rated. Again, much of this is driven by what is available in the market, not only explicit insurer strategy.
Regulatory Changes Could Consume Capital
The difference between this recent addition of bond risk and what happened from 2004 to 2007 is that the asset risk is now more recognized. As noted previously, the weighted average credit quality of the bond portfolio has become more risky, unlike the case where unknowingly risky assets had top credit ratings. In addition, the credit shifts are occurring more in the medium-range maturity of 5–10 years, and not as much for higher maturity bonds (though one sees an increase of NAIC Class 2 in these bonds as well).
Insurers may be taking on risk by reaching for yield in lower credit quality, but they feel more comfortable when this credit risk is of a relatively short duration. Recent regulatory projects also reflect this view. The Solvency II project in Europe has looked at risk capital for corporate bonds not only by credit rating, but also term to maturity, greatly increasing risk charges for longer-dated bonds. The NAIC has a project to update credit risk charges (C-1) for corporate bonds. It looks like the NAIC will not be taking a duration-based approach for its credit risk factors on bonds, but preliminary modeling has shown that risk charges could increase noticeably for some investment-grade bonds.
In addition to Risk-Based Capital (RBC) charges possibly increasing for BBB-rated bonds, the extra yield provided by these bonds may be decreasing, as credit spreads have reduced. The risk-adjusted return would thereby be decreased in terms of less of a spread as well as increased capital requirements.
What is “Normal”? Will We Ever See It?
As mentioned earlier, many insurers have been waiting for a “return to normalcy” in the interest rate environment. But looking at broader trends of interest rates, one must question if there is such a thing as a normal level of rates.
In looking at 10-year Treasury rates since 1953, one can see an overwhelming secular trend of increase up until the early 1980s, and then a general trend of falling rates. (See Figure 5.) Now, given that the industry did manage its way down from almost 10 percent at the end of 1987 to near 5 percent in 2000, one may wonder what the concern is now—especially as we saw similar low rates in the 1950s. Of course, much of it deals with product mix and especially flexible product features. Traditional pricing of crediting rates on life products has generally been a spread based on the portfolio rate. While declining rates are no fun, even as rates were relatively “normal” there was plenty of room above minimum guaranteed rates, usually at 3 percent. In the 2000s, spread compression worsened. While there has been some change in regulations to allow reduction in minimum rates in low rate environments, there still is a practical lower bound.
Figure 5: U.S. Treasury 10-Year Constant Maturity Rates (Bond Equivalent Yield Rates)
Source: Federal Reserve Bank of St. Louis
The issues of managing through different rate environments aside, there still is the issue of what the longer-term trend will be. Some have pointed out that demographic trends may be influencing the level of rates as well as returns on all sorts of capital assets. In a December 2010 report titled “Interest Rate Effects of Demographic Changes in a New-Keynesian Life-Cycle Framework,” by researchers at the European Central Bank, it was noted that both an increase in longevity and a decrease in population growth in Europe had been leading to an aging population.
The results of these long-term trends were feeding into lower equilibrium real interest rates (even going negative) as model results under a variety of assumptions. While the ultimate levels differed, all results showed an overall decreasing trend. More recent research papers have shown similar results, including “The Effects of Demographic Changes on the Real Interest Rate in Japan,” by Ikeda and Saito1, and a 2014 International Monetary Fund (IMF) working paper titled “Impact of Demographic Changes on Inflation and the Macroeconomy.”2 Results in the latter paper showed effects that the increasing elderly share of the population did reduce gross domestic product (GDP) per capita growth, which drives many macroeconomic results. This result came from sampling 30 countries from 1960 to 2013, showing this is not restricted to Japan. See Figure 6 for a comparison between U.S. and Japanese interest rates.
Figure 6: Japan Versus United States 10-Year Treasury Yield
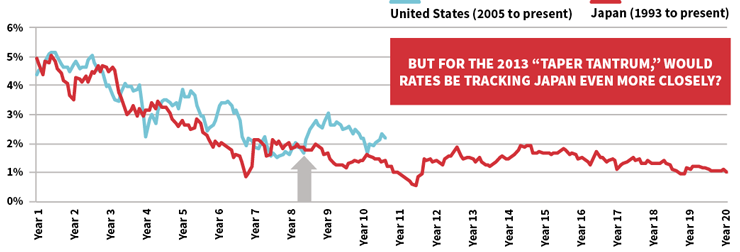
Source: Federal Reserve Bank of St. Louis
Looking at the history of U.S. Treasurys, we see the peak rates in the years that the first baby boomers were reaching their late 20s, the traditional start of the most productive working years and the heaviest borrowing to fund activities like buying homes. This cohort reached net saver status in the late 1990s when the oldest boomers turned 50.
The cohort now in this net saver age range is Generation X, once referred to as the “baby bust,” because the lowest number of births post-war in the United States occurred in the early 1970s. Their relative low numbers compared to the higher number of seniors makes for an imbalance in demand and supply in credit at higher rates. From a demographic point of view, the trend in lower rates was to be expected. Even if we take foreign investors in U.S. debt into account, these are dominated by countries that are aging faster than the United States—China and Japan are the current largest holders of these securities.
Brighter Prospects Ahead
While the current demographics mean that interest rates may stay low in the near term, with or without Federal Reserve intervention, there is a possibility the trend may reverse. The first decade of the 21st century has seen a new baby boom, with 4.3 million born in 2007 in the United States, a number higher than the prior peak in 1957. While this represents a much lower fertility rate than previously, the imbalance between savers and borrowers may tighten and bring up rates again.
To be sure, insurers don’t want to sit around waiting until 2027 to see “normal” again, but it may indicate that a regime of rising rates may come once more. Not only do life insurers need to weather the current lull of low rates, but they must remember the lessons of the late 1970s and early 1980s when rates precipitously rose, causing different sorts of destruction. The need for careful asset/liability management and risk analysis is more urgent than ever.
References:
- 1. Daisuke Ikeda and Masashi Saito. “The Effects of Demographic Changes on the Real Interest Rate in Japan.” Japan and the World Economy, November 2014, Volume 32, pages 37–48. ↩
- 2. Jong-Won Yoon, Jinill Kim, and Jungjin Lee. “Impact of Demographic Changes on Inflation and the Macroeconomy.” IMF Working Paper. WP/14/210. November 2014. ↩