
A Post-Pandemic View of Alcohol Consumption
Insights on rising alcohol-induced mortality and liver disease
January 2025Photo: Getty Images/Anatolii Frolov
The World Health Organization (WHO) states that there is no “safe” amount of alcohol consumption for optimal human health. Globally, alcohol is a major cause of liver disease and a cause or factor in up to 80% of liver-related deaths in many countries. It is responsible for more than 5% of global deaths and the leading cause of death and disability in those 15–49 years old. It accounts for 48% of all cirrhosis-related deaths and is increasingly responsible for the development of liver cancer.1
During the COVID-19 pandemic, alcohol consumption increased in many parts of the world. It is estimated that a one-year increase in alcohol consumption during the pandemic could result in the following consequences between 2020 and 2040:2
- An additional 8,000 deaths from alcohol-associated liver disease
- 18,700 cases of decompensated cirrhosis
- 1,000 cases of hepatocellular carcinoma
To explore the effects of increased alcohol consumption during the COVID-19 pandemic, this article breaks down the topic into three parts:
- A brief overview of the relationship between alcohol consumption and human health, including the effect of excess consumption on alcoholic liver disease (ALD) and mortality.
- A Reinsurance Group of America, Inc. (RGA) analysis of U.S. mortality data from the National Vital Statistics System,3,4 which includes the following key findings:
- Alcohol-induced mortality generally has increased over the studied years, with spikes occurring in the early years of the COVID-19 pandemic. These trends appear to decrease in 2022 and 2023.
- Alcohol-induced mortality is highest for later-middle-age groups and unmarried individuals.
- England and Wales have a similar age trend for alcohol-specific mortality as the United States.
- Unlike the United States, England and Wales experienced an increasing alcohol-specific mortality trend through 2022. This emphasizes the importance of further analysis by market.
Alcohol Consumption and Disease Development
The liver is responsible for filtering or metabolizing blood toxins such as alcohol, storing energy, making hormones and proteins, and regulating cholesterol and blood sugar. Depending on the extent over time, alcohol consumption can cause mild, moderate or severe liver damage, producing a buildup of fat, inflammation and chronic scarring (cirrhosis).8
In 2020, the first year of the COVID-19 pandemic, alcohol use accounted for 1.78 million deaths globally and was the leading risk factor for mortality among males ages 15–49.9 However, evaluating quantities of alcohol consumption can be difficult, as the percentage of ethanol, an ingredient in alcohol, varies by drink type. The definition of a “standard” drink also varies by country. For example, in the United States, a standard drink measure contains 14 grams (0.6 fluid ounces) of pure alcohol, while in the United Kingdom, the measure is only 8 grams. The World Health Organization (WHO) recommends using 10 grams of alcohol to denote a standard drink.10
Alcohol metabolism occurs mainly in the liver and can cause DNA damage. Its carcinogenic effect can lead to oral, pharyngeal, laryngeal, esophageal, liver, colorectal and breast cancers.11 The International Agency for Research on Cancer (IARC) classifies alcoholic beverages, ethanol in alcoholic beverages and their metabolic byproduct (acetaldehyde) as carcinogenic to humans. Alcohol is the third most significant modifiable cancer risk factor, following tobacco use and obesity.12
According to the Global Burden of Disease Study (GBD) 2020, 1.03 billion males and 312 million females (35.1% and 10.5% of the populations > 15 years, respectively) consumed alcohol in amounts exceeding healthy levels in 2020.13
A meta-analysis of studies from January 1990 to January 2008 found that men and women who consume more than 60 grams of alcohol per day are at 14- and 22.7-fold increased risks of cirrhosis-related death, respectively, compared with nondrinkers. Alcohol-associated liver disease has emerged as the second-most-common reason for liver transplant worldwide and the most common reason for liver transplant in the United States.14
In 2020, an estimated 741,300 new cancer cases globally (4.1% of all cancers) were due to alcohol consumption, of which 568,700 were in men. Among multiple cancers attributable to alcohol, the most common were esophageal (189,700), liver (154,700) and breast (98,300) cancers.15 By 2040, global cases and deaths from liver cancer are predicted to increase by more than 55%, resulting in 1.4 million people diagnosed with the disease and 1.3 million dying as a result. Alcohol use has surpassed hepatitis B and C as the most common cause of hepatocellular carcinoma, now accounting for 18.4% of cases. An estimated 17% of all liver cancer cases diagnosed in 2020 could have been avoided by reducing alcohol consumption.16,17
Alcohol-induced Mortality Trends in the United States
To examine the mortality impacts of alcohol on the U.S. population, RGA studied the alcohol-induced mortality trends through an analysis of the mortality data from the National Vital Statistics System.18,19 Findings revealed that alcohol-induced mortality rates have been increasing over time, with sharper increases occurring in the first few years of the COVID-19 pandemic.
When analyzing trends within the United States, increases in alcohol-induced mortality began to slow in 2017–2019, with a significant uptick in 2020, coinciding with the COVID-19 pandemic. Interestingly, alcohol-induced mortality rates appear to have decreased in 2022. Such trends were noticed across all education levels, but the trends specific to university-educated individuals can be especially telling for a potentially insured population, as shown in Figure 1.
Figure 1: Alcohol-induced Mortality Rates for University-educated Individuals Age 25+ in the United States, 2007–2022
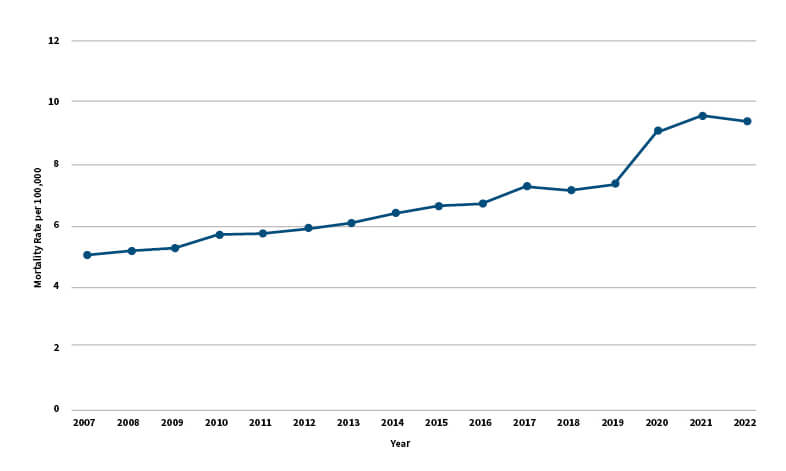
Source: RGA analysis of National Center for Health Statistics, National Vital Statistics System, mortality data files
As shown in Figure 2, later-middle-aged individuals experience the highest alcohol-induced mortality. These age trends are possibly attributable to the long-term nature of alcohol-related conditions. For example, it may take many years of harmful alcohol consumption to develop alcohol-associated hepatic steatosis and even longer to progress to alcohol liver cirrhosis.20 This also does not mean immediate death, as the life expectancy of people with cirrhosis is two to 14 years.
Figure 2: Alcohol-induced Mortality Rates by Age and Marital Status in the United States in 2022
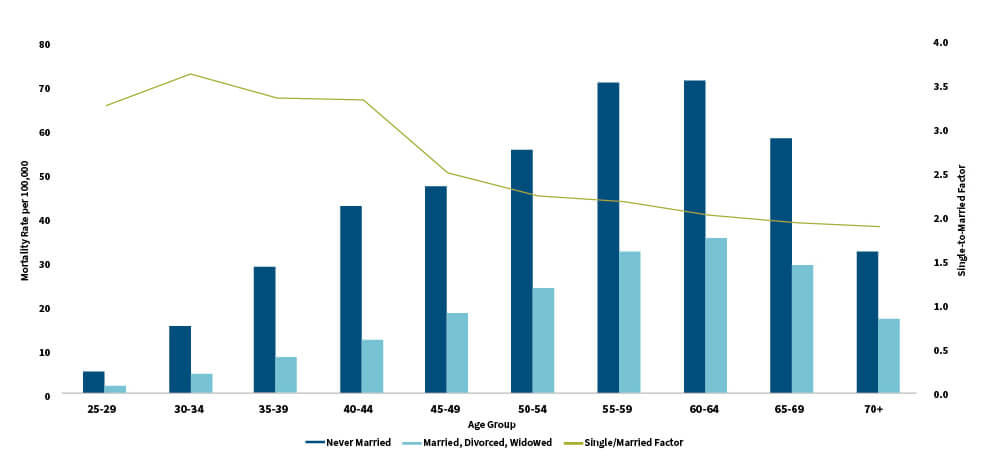
Source: RGA analysis of National Center for Health Statistics, National Vital Statistics System, mortality data files
Note: Due to data limitations, the comparison for age and marital status was not limited to university-educated individuals, as shown in Figure 1.
Marital status is also an indicator of alcohol-induced mortality risk. Never-married individuals exhibit elevated alcohol-induced mortality rates as high as nearly four times the alcohol-induced mortality rates of their once-married counterparts for certain ages. This difference generally decreases with age.
Alcohol consumption and mortality trends are rapidly evolving. Assessing the provisional mortality data for the general U.S. population reveals a decreasing trend in alcohol-induced mortality rates for adults ages 25+ beginning in 2022 and extending into 2023. Will these decreasing trends continue? Will mortality return to pre-pandemic levels? Only time will tell, but the provisional U.S. trends provide some hope, as shown in Figure 3.
Figure 3: Provisional Alcohol-induced Mortality Rates for Age 25+ in the United States, 2018–2023

Source: RGA analysis of National Center for Health Statistics, National Vital Statistics System, provisional mortality data files on CDC WONDER Online Database
Note: Due to data limitations, this analysis is not limited to the university-educated population as shown in Figure 1. Deaths through Nov. 2, 2024, as of Nov. 10, 2024. Data for 2024 was excluded due to being a partial year at the time of analysis. As noted within CDC WONDER: “The July 1, 2022, population estimates are used as denominators for calculating provisional death rates in year 2022 and later years.”
Comparison to Experience in England and Wales
The concerning alcohol-induced mortality trends are not exclusive to the United States. A University of Sheffield report based on data from England documented the changes in the prevalence of risky drinking behavior from the pandemic. It showed that adults in England had greatly increased risky drinking during the pandemic relative to prior years. More specifically, individuals who were considered high-risk drinkers showed increases in risky drinking behavior, while low-risk drinkers actually showed decreases in risky drinking behavior. Among risky drinkers, males and the 25–34 age group saw the largest increases.21
Similar to the United States, England and Wales experienced higher alcohol-specific mortality among later-middle-aged groups. England and Wales also saw an increasing mortality trend with a spike that coincided with the COVID-19 pandemic. However, in England and Wales, this trend continued through 2022, unlike in the United States, where alcohol-specific mortality experience has improved.22
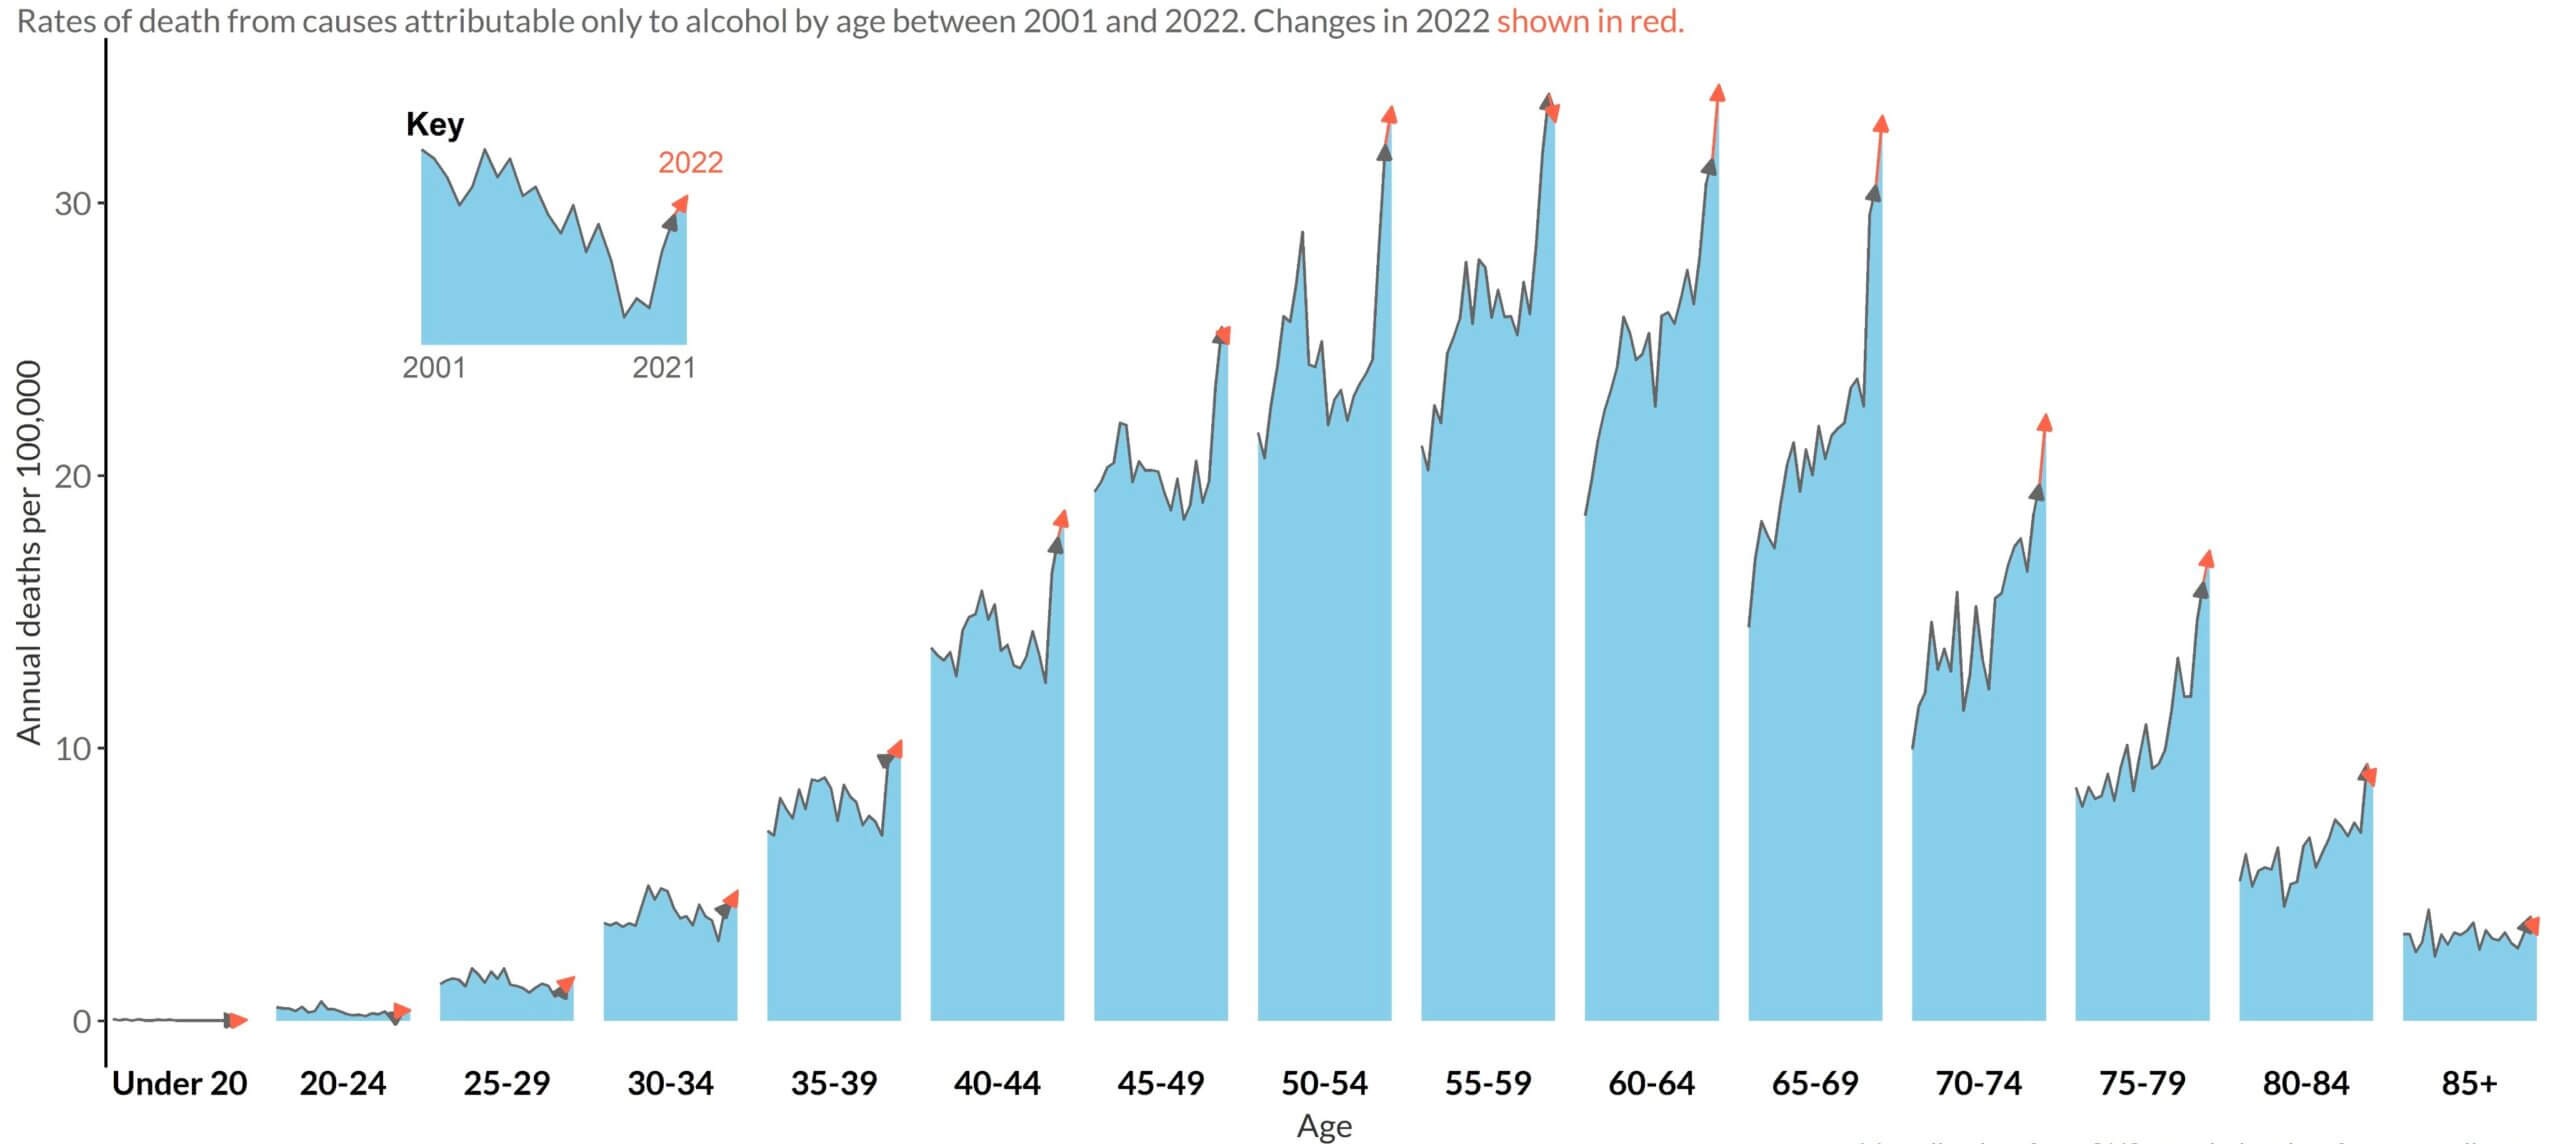
Source: Mortality data from ONS, population data from mortality.org | Plot by @VictimOfMaths | Provided by Colin Angus with permission
The University of Sheffield report also projected alcohol-specific excess deaths in England based on a variety of alcohol consumption scenarios, as shown in Figure 5.23 Unsurprisingly, the worst-case scenario—alcohol consumption increases further24—showed the highest projected excess deaths, which continue for many years. Notably, when comparing these projections to the first few years of actual excess deaths (indicated as orange data points), the actual excess deaths from alcohol were even higher than this scenario.25
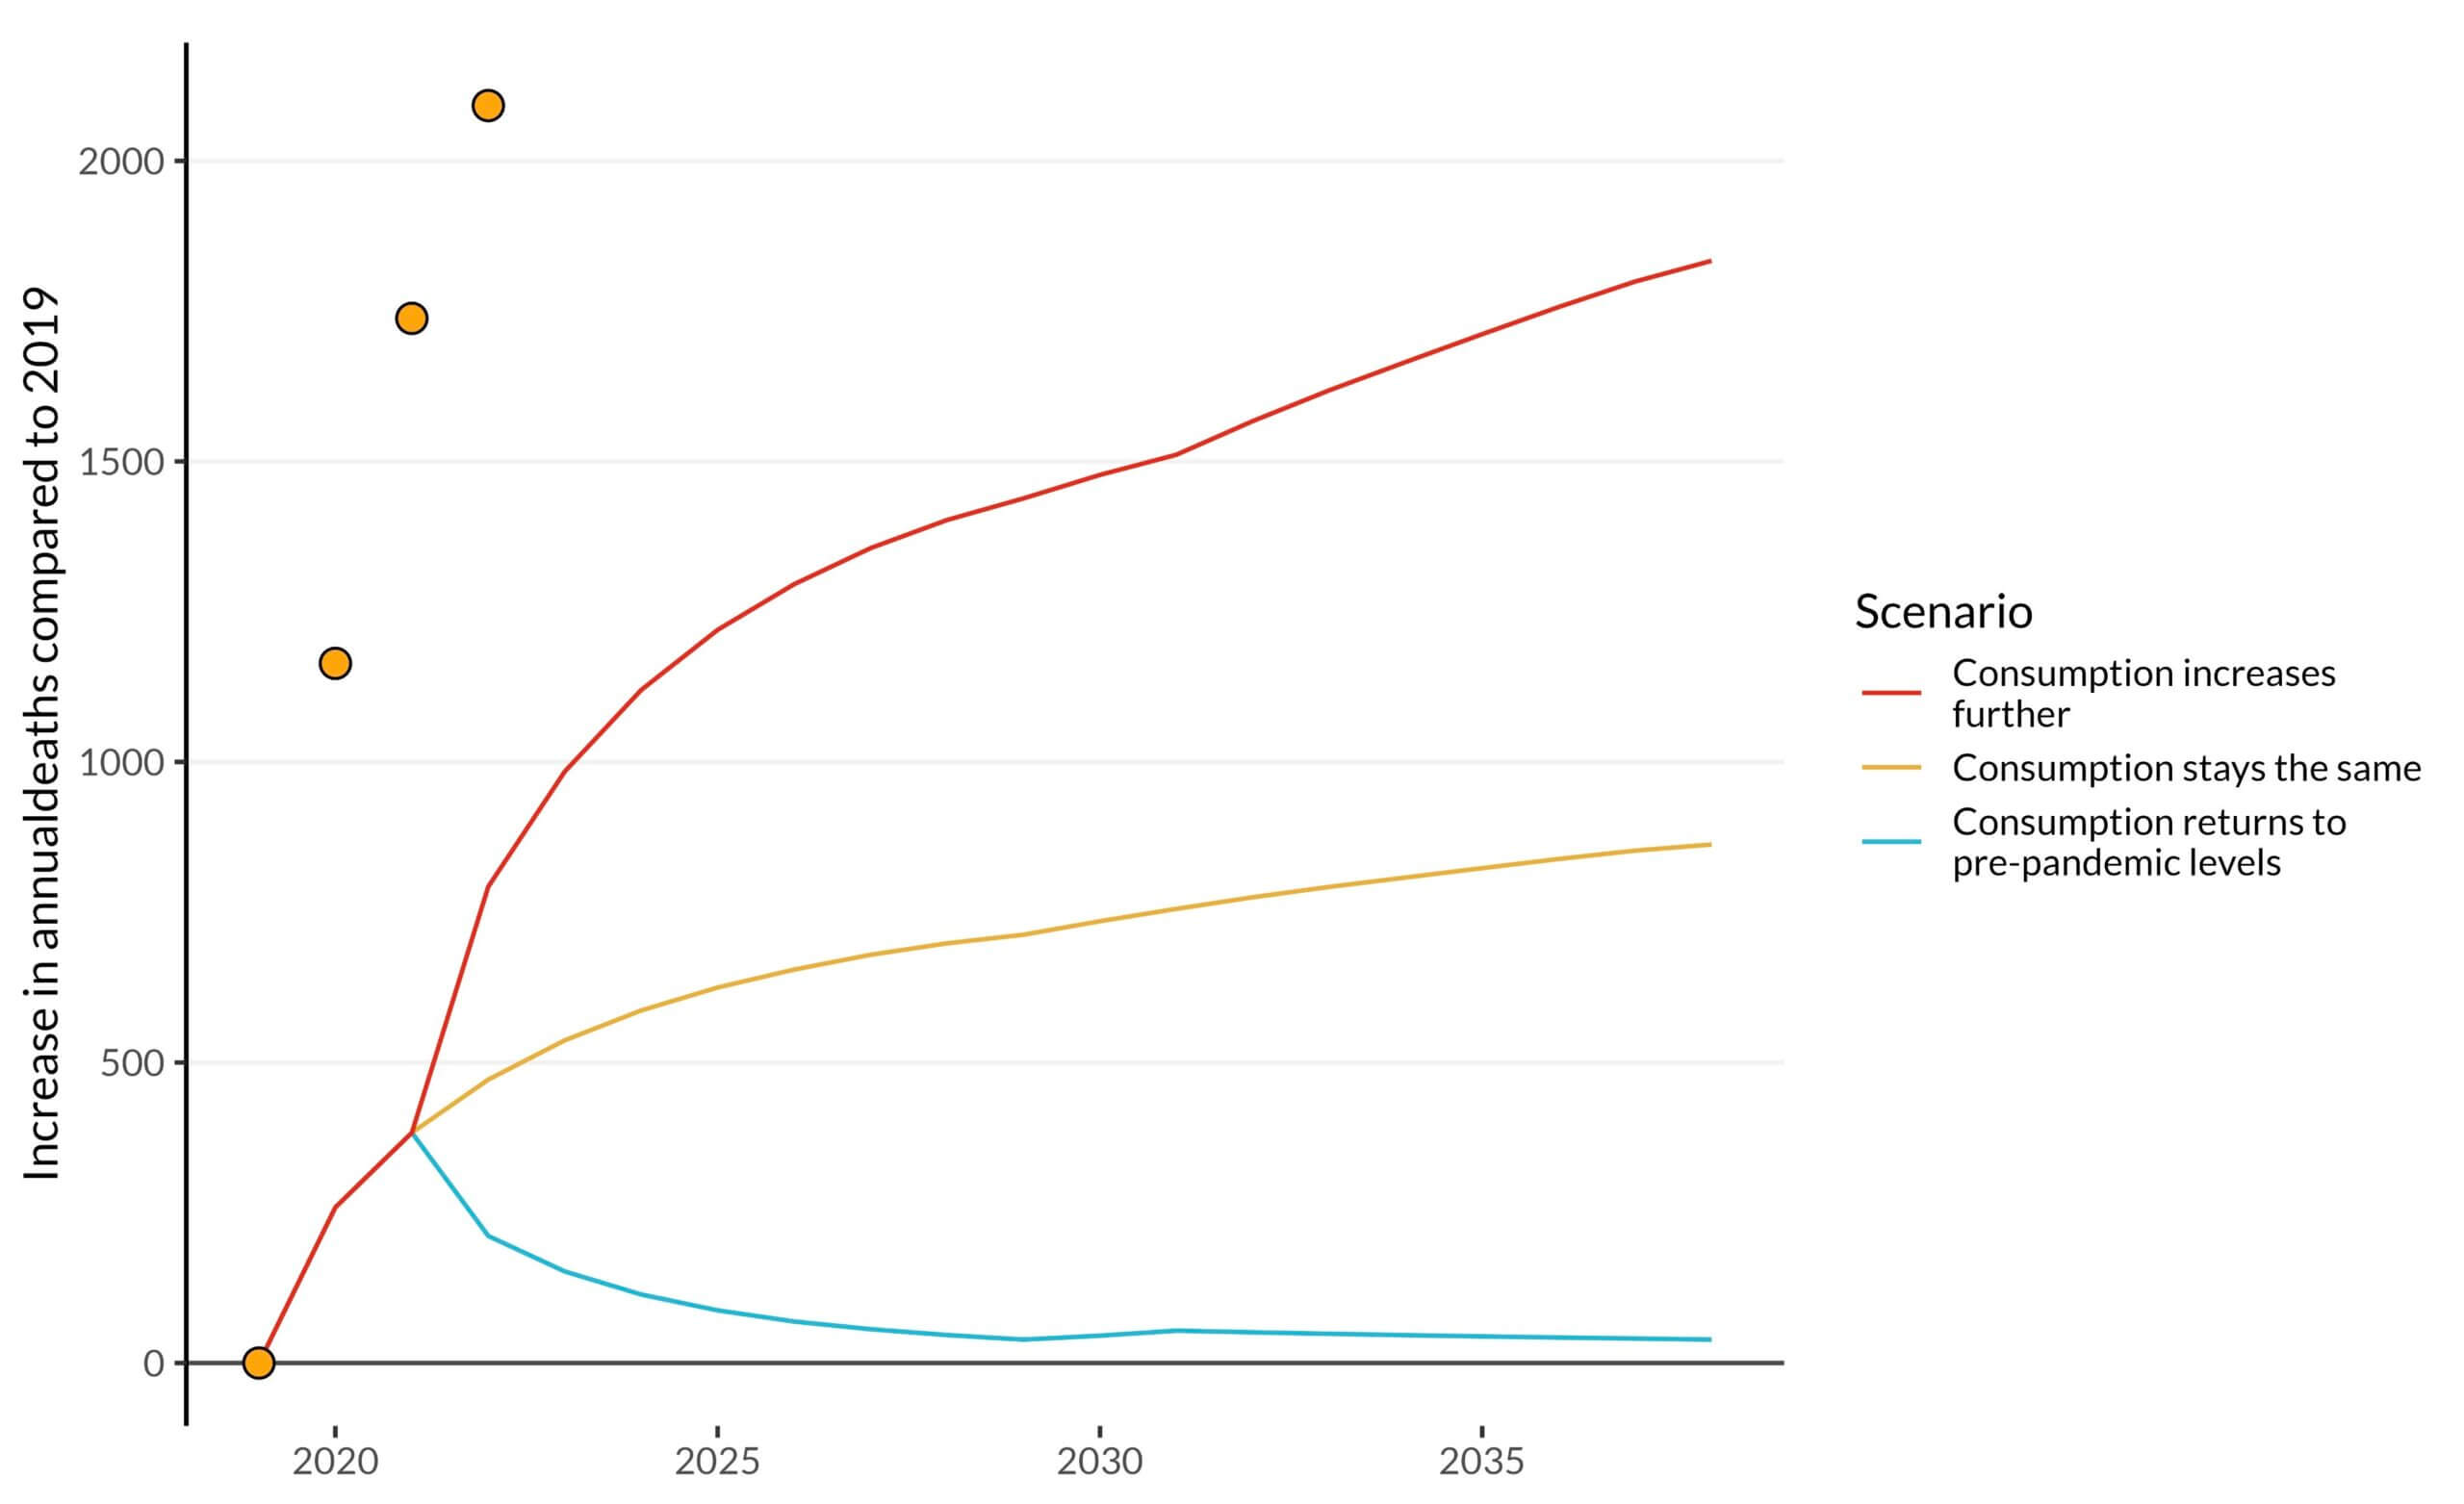
Source: Alcohol-specific deaths data from ONS | Modelled scenarios from Angus et al. 2023 | Plot by @VictimOfMaths | Provided by Colin Angus with permission
The experience noted in England presents some alarming findings, such as higher-than-projected alcohol-specific excess deaths, as well as an increasing trend through 2022. Could this indicate that further increases may continue? Or will England perhaps experience a decrease similar to the United States? It is difficult to predict, but the findings emphasize the need for further analysis and ongoing monitoring.
Conclusion
Excessive alcohol consumption increases the risk of liver disease and early death. Alcohol is a cause or factor in up to 80% of liver-related deaths and the leading cause of death and disability in those 15–49 years old. Rates of liver cancer have been rising steadily over the past two decades, while rates of liver transplants for alcohol-related liver disease also increased during the same period. As diseases and deaths from ALD are predicted to continue to increase, there are rising concerns as to how life insurance claims related to excess alcohol consumption will be affected.
RGA analyzed general U.S. population data and found that alcohol-induced mortality has generally increased over the past 15+ years, with a spike occurring during the early phases of the COVID-19 pandemic. More recent data in 2022 and provisional 2023 data provide hope that reductions in alcohol-induced mortality may be on the horizon for the United States.
England and Wales experienced similar increases, especially for certain demographic groups during the acute phase of the COVID-19 pandemic. However, rather than slowing down in 2022 as in the United States, those increases continued in England and Wales. This difference between the two regions highlights the need to monitor and analyze alcohol-induced mortality trends across different geographies to understand the broader story around alcohol consumption and mortality.
Appendix
CDC Multiple Cause of Death Analysis—Data Notes and Cause of Death Definition
RGA analyzed data from the CDC Multiple Cause of Death mortality files. The analysis depicted in Figures 1 and 2 was derived from the final mortality data files, while Figure 3 analysis was derived from the provisional data files. These mortality files contained demographic variables such as age, marital status and education, along with underlying and multiple causes of death indicating up to 20 contributing conditions to the death record. Population data was obtained from the U.S. Census Bureau26 to calculate mortality rates for the final mortality data by specific demographic variable. Provisional data had population numbers included by the CDC. Thus, there are slight differences in population counts used to calculate mortality rates, but these were determined to be immaterial for the purpose of this research.
In defining an alcohol-induced death, records with the following ICD-10 codes marked in the underlying cause of death were included:
- E24.4 Alcohol-induced pseudo-Cushing’s syndrome
- F10 Mental and behavioral disorders due to use of alcohol
- G31.2 Degeneration of nervous system due to alcohol
- G62.1 Alcoholic polyneuropathy
- G72.1 Alcohol myopathy
- I42.6 Alcoholic cardiomyopathy
- K29.2 Alcoholic gastritis
- K70 Alcoholic liver disease
- K85.2 Alcohol-induced acute pancreatitis
- K86.0 Alcohol-induced chronic pancreatitis
- R78.0 Excess alcohol blood levels
- X45 Accidental poisoning by and exposure to alcohol
- X65 Intentional self-poisoning by and exposure to alcohol
- Y15 Poisoning by and exposure to alcohol, undetermined intent
Note: Other studies may define “alcohol-specific,” “alcohol-induced,” “alcohol-attributable” or “alcohol-related” deaths differently.
Editor’s note: Craig Armstrong and Olivia Johnson of RGA assisted in the England-based research and U.S. mortality analysis, respectively. Colin Angus of the University of Sheffield provided updated charts for Figures 4 and 5.
Statements of fact and opinions expressed herein are those of the individual authors and are not necessarily those of the Society of Actuaries or the respective authors’ employers.
References:
- 1. Prince, David Stephen, Emily Nash and Ken Liu. 2023. Alcohol-Associated Liver Disease: Evolving Concepts and Treatments. Drugs 83, no. 16:1,459–1,474. ↩
- 2. Julien, Jovan, et al. 2022. Effect of Increased Alcohol Consumption During COVID-19 Pandemic on Alcohol-associated Liver Disease: A Modeling Study. Hepatology 75, no.6:1,480-1,490. ↩
- 3. National Center for Health Statistics. Vital Statistics Online Data Portal: Mortality Multiple Cause Files. Centers for Disease Control and Prevention, December 19, 2024. ↩
- 4. National Center for Health Statistics Mortality Data on CDC WONDER: Provisional Multiple Cause of Death Data. CDC WONDER. ↩
- 5. Angus, Colin, Maddy Henney, and Rob Pryce. Modelling the Impact of Changes in Alcohol Consumption During the COVID-19 Pandemic on Future Alcohol-related Harm in England. The University of Sheffield, April 2022. ↩
- 6. Angus, Colin. @VictimOfMaths. There are some interesting, although alarming, age patterns in these new figures. The biggest increases in alcohol-specific deaths in 2022. X, April 22, 2024. ↩
- 7. Angus, Colin. @VictimOfMaths. This is why I’m *really* worried about the record high alcohol-specific deaths figures that ONS published yesterday. X, April 23, 2024. ↩
- 8. Supra note 1. ↩
- 9. GBD 2020 Alcohol Collaborators. 2022. Population-level Risks of Alcohol Consumption by Amount, Geography, Age, Sex, and Year: A Systematic Analysis for the Global Burden of Disease Study 2020. The Lancet, 400:185–235. ↩
- 10. Supra note 1. ↩
- 11. Gapstur, Susan M., et al. 2023. The IARC Perspective on Alcohol Reduction or Cessation and Cancer Risk. The New England Journal of Medicine 389, no. 26:2,486–2,494. ↩
- 12. Yoo, Jung Eun, et al. 2022. Association Between Changes in Alcohol Consumption and Cancer Risk. JAMA Network Open 5, no. 8. ↩
- 13. Supra note 9. ↩
- 14. Supra note 1. ↩
- 15. Rumgay, Harriet, et al. 2021. Global Burden of Cancer in 2020 Attributable to Alcohol Consumption: A Population-based Study. The Lancet Oncology 22, no. 8:1,071–1,080. ↩
- 16. Liu, Yuan-Bin, and Ming-Kai Chen. 2022. Epidemiology of Liver Cirrhosis and Associated Complications: Current Knowledge and Future Directions. World Journal of Gastroenterology 28, no. 41:5,910–5,930. ↩
- 17. International Agency for Research on Cancer. Number of New Cases and Deaths From Liver Cancer Predicted to Rise by More Than 55% by 2040. World Health Organization, October 6, 2022. ↩
- 18. Supra note 3. ↩
- 19. Supra note 4. ↩
- 20. Supra note 1. ↩
- 21. Supra note 5. ↩
- 22. Supra note 6. ↩
- 23. Supra note 5. ↩
- 24. The University of Sheffield report describes the worst-case scenario as: “From 2022 onwards, all drinkers who reduced their drinking during the pandemic return to pre-pandemic levels. Drinkers who increased their drinking during the pandemic increase it further, reflecting lost on-trade consumption being added back into people’s drinking habits. This further increase takes the form of the smaller value of: i) either the same increase again as was seen between 2019 and 2020, or ii) the total volume of on-trade consumption pre-pandemic.” ↩
- 25. Supra note 7. ↩
- 26. CPS Historical Time Series Tables: Table A-4. Detailed Years of School Completed by People 25 Years and Over: 2000 to 2022. United States Census Bureau, February 9, 2023. ↩
Copyright © 2025 by the Society of Actuaries, Chicago, Illinois.