
Factor That
Why global demographics matter for macro-finance
February/March 2016This article highlights unprecedented demographic changes affecting the world of macro-finance and investments in terms of both risks and returns. It is written in the spirit of sharing research at the interface of demographics, behavioral finance, financial economics and macro-economics used in discussions with policymakers, academics and investors in more than 50 countries globally. We normatively highlight that demographics do not only have effects on the liability side but also on the asset side by affecting gross domestic product (GDP) per capita, disposable income, savings, capital flows and asset returns.
We point to links between macro policy and macro fundamentals that affect asset pricing and returns, suggesting macro policy and investments are connected endogenously. We argue that the perspective of demographics relating to age alone or large numbers of young people is a narrow one, stressing instead that demographics are about “people characteristics.” From an economic viewpoint, the important characteristics of people are that they are consumers (from birth to death) and workers for a significant part of their lives. There are approximately 7.35 billion consumers and 3.45 billion workers in the world today whose demographics affect global macro-finance.
Mischaracterizations of Demographics
There are a few mischaracterizations relating to demographics. The first is that demographics is only about age. How people consume and how they work are not merely functions of their age, but also of other characteristics that matter such as gender, education, parental background, migrant status, where they grow up, their wealth, etc.
A second is the association of positive future demographic prospects with “large numbers of young people” in emerging countries. Many young people with poor health, poor education, poor skills and poor access to technology do not automatically make for great future demographic prospects.
Another mischaracterization has to do with believing that “demographics is predictable.” While the age aspect of demographics is predictable, how people change as consumers and workers is not predictable as the workplace and consumer markets are evolving, too. Advances in behavioral finance and experimental economics research have shown risk behavior, investment behavior, etc., to be related to psychological and behavioral characteristics of individuals that have not yet been fully incorporated in actuarial and financial models.
The above-mentioned common misconceptions have led to us collectively paying less attention to historically unprecedented demographic changes. These changes are not homogenous, simple or occurring at a predictable pace due to the interplay of worker behavior with changes in the workplace and consumer psychology with increased product availability.
One example of an overlooked change is the fact that the median age changes have been large and very diverse across countries by historical standards (changes over the last 45 years used to take 200–300 years). Figure 1 shows that the changes in median ages across the United States, Japan and Germany over the course of 1970–2015 are not uniform, and neither are the levels. The latest 2015 median age in the United States is 38 years; in Europe it’s 41.7 years; and Japan and Germany have median ages of 46.5 years and 46.2 years, respectively. The overall global impact of these changes has been underestimated collectively by policymakers, financial services, insurance and pensions, contributing to worsening fiscal positions on account of growing public debt.
| Figure 1: Population Median Age (In Years) | ||
|---|---|---|
| 1970 | 2015 | |
| Germany | 34.1 | 46.2 |
| Japan | 28.9 | 46.5 |
| United States | 28.3 | 38.0 |
Source: UN, Credit Suisse Demographics Research
Another important example relates to the fact that the retiree population is not all homogenous. The 80+ age group was the fastest growing age group in the world from 1970–2015, growing at nearly four times the rate of the total population. In advanced countries, a person older than 80 years costs significantly more in terms of health care and long-term care than a 65-year-old individual. We need to pay greater attention to the heterogeneity across the very old age groups, as they are responsible for creating a fiscal and social burden unlike any that we have seen before.
Figure 2 illustrates the growth of the 80+ age group relative to the 60+ age group and the total population over 1970–2015. The growth rates of the 80+ age group are multiples of growth rates of the 60+ age group and of the total population. This is a challenge to conditional life expectancy models that have also fallen short of modeling these changes accurately and should combine different approaches.1
| Figure 2: Population Growth of Different Age Groups: 1970–2015 | ||||
|---|---|---|---|---|
| World | Germany | Japan | United States | |
| Total population | 100% | 3% | 22% | 54% |
| 60+ years | 199% | 43% | 281% | 126% |
| 80+ years | 394% | 201% | 945% | 217% |
Source: UN, Credit Suisse Demographics Research
Demographic Linkages to GDP and GDP Per Capita Growth
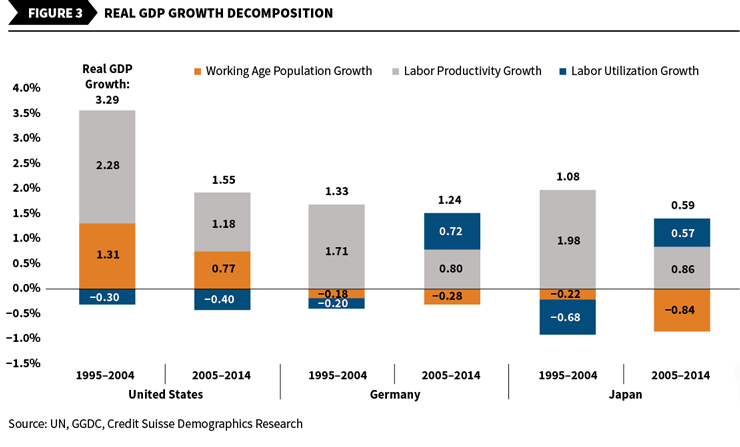
It is important from an investment perspective to understand GDP growth (China, United States or global) as it affects financial development, investments and trade. As per a standard macroeconomic framework,2 GDP growth can be decomposed into three demographic components:
- Working age population growth—people aged 15 to 64
- Labor productivity growth—amount of GDP produced by an hour of labor
- Labor utilization growth—number of hours worked
These factors are not constant for a country over time and vary across countries. As Figure 3 shows, the GDP growth decomposition across the United States, Germany and Japan over the last 20 years is very different. The GDP growth number is displayed above the bar and the component contributions are shaded within the bars. While growth rates have declined, the factors have contributed differently to lower growth patterns.
While GDP growth is important to follow, we should note that GDP per capita growth is also very important. GDP per capita is a measure of living standards within a country. A country may have high real GDP growth but low GDP per capita growth, or vice versa. Figure 4 makes this point.
| Figure 4: GDP, GDP Per Capita, Population Growth | ||||
|---|---|---|---|---|
| GDP Growth | Population Growth | GDP per Capita Growth | ||
| Germany | 1980–1985 | 1.19% | −0.18% | 1.4% |
| 2010–2015 | 1.96% | −0.03% | 2.0% | |
| Japan | 1980–1985 | 4.28% | 0.68% | 3.6% |
| 2010–2015 | 1.35% | −0.17% | 1.5% | |
| United States | 1980–1985 | 3.36% | 0.92% | 2.4% |
| 2010–2015 | 2.14% | 0.70% | 1.4% | |
Source: UN, Credit Suisse Demographics Research
GDP per capita growth and its accumulation over time lead to increased living standards for a country’s citizens. Higher incomes then allow the citizens to allocate the income across savings and consumption. Savings from income gets invested and contributes to financing through banks and other financial intermediaries. Savings less investments at an aggregate macro level affect current account and capital flows, as well as equity premia, equity returns and bond returns. Through effects on income, savings, capital flows, current account and debt levels, demographics plays a role on the asset side of insurance and pensions in an application life cycle management (ALM) sense.
Gender Inequality, Youth Participation and GDP Growth
Although increasingly more women participate in the labor market, the labor force participation rate gap between men and women remains high.3 In 2014, Japan had the highest gender gap of the G6 countries at 21 percent; Germany, the United States and the United Kingdom had gaps of 12 percent; France had a 9 percent gender gap; and the gap in Nordic countries was close to 5 percent. If this gap was close to zero, the GDP growth would be a lot higher compared to what it is today. Gender income differences (males versus females) also remain high, with Japan having the biggest wage difference by a factor of 2.32 times.
Women are increasingly becoming better educated and wealthier, making them attractive as potential decision-making customers. As they live longer than men, too, and are nearly half the total population, they should equitably be allowed the same access to the labor market and the same wages as men. This will in turn boost the aggregate expenditures leading to higher GDP levels and higher growth. A similar argument is made for increased youth labor force participation leading to higher labor productivity growth.
Immigration and Labor Growth
As populations age and decrease (e.g., Germany and Japan), immigration becomes a factor that can mitigate aging and labor force pressures. Today, the highest life expectancy country, Hong Kong, has a lower fiscal burden than the second-highest life expectancy country, Japan, as more than half of its population change is due to younger immigrants. We contrast Germany and the United States (Figure 5) to show that negative natural population change is offset by net migration in Germany but is complemented and added to by net migration in the United States.
| Figure 5: Population Changes: Natural (Births Less Deaths) and Net Migration (In Thousands) | ||||||
|---|---|---|---|---|---|---|
| Germany | United States | |||||
| Population Change Components | ||||||
| Natural Population | Net Migration | Population | Natural Population | Net Migration | Population | |
| 1990–1995 | −578 | 3,233 | 2,655 | 8,859 | 4,569 | 13,428 |
| 2010–2015 | −997 | 1,250 | 253 | 6,890 | 5,008 | 11,897 |
Source: UN, Credit Suisse Demographics Research
Fiscal Unsustainability of Pensions, Health Care and Long-Term Promises
Higher old-age dependency ratios across aging countries lead to increasing age-related expenditures. Age-related expenditures (health, pensions and long-term care) represent more than 20 percent of GDP in both Japan and Germany, and in the EU 78 percent of total benefits get spent on them. No country can afford these long-term promises based on current growth and revenue collections. It is vital that people be made aware of these unsustainable promises, especially in a lower growth and lower interest rate environment. Citizens need to increase their savings as governments have made unsustainable promises that they will not be able to deliver.4
More holistic and robust approaches to modeling longevity are needed, as highlighted by Haberman & Renshaw (2011) and Booth and Tickle (2008), and these should extend beyond Carter-Lee variants of modeling longevity. Also, governments and societies must address existing longevity challenges. This will require: flexible e-enabled retirement with no mandatory retirement age, increased female labor force participation with technology, selective (skilled and unskilled) migration, and outsourcing.5 As argued to global governments and financial investors in “Why Increasing Longevity Affects Us All” (2012), this will require promotion of new financial services—especially pensions and insurance products—for not just the old but also the young in keeping with changes in life cycle, longevity, growth, interest rates, inflation, asset returns and regulation.
Older Consumers and Workers—Why We Got Them Wrong
I present something that collectively has been missed by academics, investors and researchers as we were guided by past data to make decisions. The 65–74 age group now is one of the richest age groups, in contrast to the 1970s when they were the poorest. (See Figures 6 and 7.) Ignoring this age group as consumers, savers and investors based on past trends is a common error that we need to reverse. Fortunately, the largest consumer companies, investors, insurance companies and central banks in Japan and Germany have recently started adapting to this.
| Figure 6: Median Income by Age Group, Constant 2014 USD | |||
|---|---|---|---|
| Age Group | 1990 | 2014 | % Change |
| 15–24 | $9,780 | $10,420 | 7% |
| 25–34 | $30,033 | $31,219 | 4% |
| 35–44 | $37,511 | $38,680 | 3% |
| 45–54 | $37,759 | $40,000 | 6% |
| 55–64 | $27,629 | $34,498 | 25% |
| 65+ | $17,880 | $22,248 | 24% |
| 65–74 | $19,733 | $25,143 | 27% |
| 75+ | $16,035 | $19,209 | 20% |
Source: U.S. Census Bureau, BLS, Credit Suisse Demographics Research
| Figure 7: Median Household Net Worth by Age Group, Constant 2011 USD | |||
|---|---|---|---|
| Age Group | 2000 | 2011 | |
| Younger than 35 | $9,765 | $6,676 | |
| 35–44 | $37,511 | $38,680 | |
| 45–54 | $59,689 | $35,000 | |
| 55–64 | $150,866 | $143,964 | |
| 65+ | $146,205 | $170,516 | |
| 65–79 | $154,226 | $194,226 | |
| 70-74 | $161,027 | $181,078 | |
| 75+ | $134,535 | $155,714 | |
Source: U.S. Census Bureau, BLS, Credit Suisse Demographics Research
Not only are the older age groups richer than they have ever been, they consume very differently than when they were young and than the young age groups today, as shown in Figures 8 and 9. Our research shows that the young today are also very different than the older age groups when they were young, demonstrating differences in behavior between the millennial generation and the baby boomers. Consumer changes by way of age structure, GDP per capita and household structure affect aggregate consumer expenditures, savings, capital flows and inflation as shown in published macroeconomic and financial research. The financial services industry needs to pay greater attention to this just like the pharmaceutical and consumer industries have.
| Figure 8: U.S. Household Composition Numbers by Household Size (In Thousands) | ||
|---|---|---|
| Household Size | 1990 | 2015 |
| 1 | 22,925.9 | 34,650.0 |
| 2 | 29,901.8 | 40,470.9 |
| 3 | 16,213.0 | 19,313.7 |
| 4 | 14,070.7 | 15,852.7 |
| 5+ | 10,235.7 | 13,272.9 |
Source: Euromonitor, Consumer Expenditure Survey BLS, Credit Suisse Demographics Research
| Figure 9: Household Consumption Breakdown, by Age Group and Main Categories, 2014 | |||
|---|---|---|---|
| Share (%) | 25–34 Years | 65+ Years | 75+ Years |
| Food | 13.4 | 12.5 | 11.9 |
| Housing | 35.1 | 33.9 | 36.5 |
| Transportation | 18.0 | 15.9 | 13.9 |
| Health care | 5.4 | 13.4 | 15.6 |
| Personal insurance | 11.0 | 5.2 | 2.8 |
Source: Euromonitor, Consumer Expenditure Survey BLS, Credit Suisse Demographics Research
Conclusion
Demographics is not all about age or counting the number of people. It is about consumers and workers of all ages, who affect macro fundamentals—debt, growth, consumption, savings, investments, capital flows and asset prices. A holistic understanding of demographic influence on macro variables is essential for the actuarial profession, which plays a key and relevant role in managing risk associated with both assets and liabilities. These developments affect both the asset and liability sides, necessitating newer approaches to product development, risk management and asset allocation.
Special thanks to Anaïs Boussié and Mengyuan Yuan for their collaborative input while writing this article.
References:
- 1. See “Uncertain Approaches to Longevity: Towers Watson Public Lecture on Longevity” (2005); R. Fogel (2005), “Changes in Physiology of Ageing in the Twentieth Century,” NBER; H. Booth and L. Tickle (2008), “Mortality Modeling & Forecasting: A Review of Methods,” AAS: 3, 1/11. 3–43; Haberman & Renshaw (2011), “A Comparative Study of Parametric Mortality Projection Models,” Insurance: Mathematics and Economics,48(1), 35–55. ↩
- 2. A framework developed by ECB and used by main central banks, academics and financial institutions globally. ↩
- 3. We advised governments facing labor shortages to take policy actions to close the gender participation gaps. ↩
- 4. Age of Responsibility, a cross-institutional report to U.K. government on savings,
pensions, education and health. ↩ - 5. Credit Suisse Demographic’s Research (2000), Demographic Manifesto: New Jobs, New People. ↩
Copyright © 2016 by the Society of Actuaries, Chicago, Illinois.