
Game On
Utilizing games to better understand policyholders in the life insurance realm
February/March 2017Today, most actuaries still apply mortality assumptions based on a few risk characteristics, such as age, gender and smoking status. The assumption sets are normally separated across insurance products and might include three to five underwriting classes, even when there could be hundreds of them in the real world.
In the future, we can easily picture how the digital footprints we leave online, and those tracked by “smart” devices, can be used to provide more pleasant customer experiences through simpler processes and/or more refined risk-based pricing analyses. We already see signs of these changes: Sun Life Canada loosened its medical underwriting requirements based on results from claims behavior analysis,1 and Aviva America is experimenting with identifying potential health risks through online purchasing behavior.2
The mechanism that will bring about these changes seems clear enough: As finer splits of the data and underlying causes become available and practical,3 competition will drive market players (whether existing or new) to target more attractive risk groups that previously were overpaying. An example is the pay-per-mile auto insurance model from Metromile. Technological advances and increased acceptance of tracking devices allows for more cost-effective means of tracking car usage, which opened the opportunity to sell to a “new” segment of drivers who were driving far less frequently than others (e.g., weekend drivers) and whose insurance premiums were not reflecting this difference.
While property and casualty insurers are rightly focused on opportunities brought about by smart devices, the question for life insurers then is how such a mechanism would work on the life and health side—will there be any progress made, and who will be pushing things forward along this path? In this article, we introduce some of the initiatives we’re trying, and why we think these (seemingly frivolous) attempts might become something meaningful. See Figure 1.
Figure 1: Different Paths to the Future
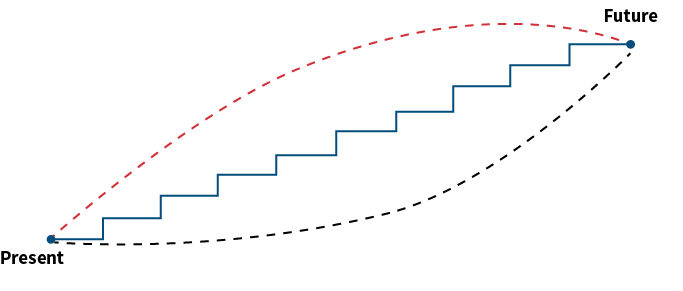
We have a good guess as to what the future will look like (an increasing number of things tracked and accounted for). The challenge is moving from the current state to such a future state, and finding the path that will get us there.
Back to Basics—Focusing on Mortality
Mortality is the most fundamental risk life insurers bear. Life contingencies is often one of the first classes on the actuarial syllabus. The basic life tables we were taught to look up include age, gender and smoking status, in the same way industry tables are split. Yet, we all intuitively know that there are many additional individual factors affecting mortality, and the highly aggregated basis on which we develop and study assumptions is increasingly being challenged.
The Lack of Data
It’s fair to say that the biggest impediment to more advanced practices being applied is the actuary’s lack of access to richer data sets that an insurance company theoretically should have about its policyholders. Mortality research is limited to smaller groups of people within the organization, and they often do not have access to data in underwriting, marketing and customer relationship management (CRM) systems, for example. Furthermore, a lot of data is “stored” with the insurance salesperson, and such information rarely makes its way to the actuary’s desk.
Consequently, the actuarial function has a very incomplete view of the individual policyholders. This leads to cross-subsidizations that might not be fair to policyholders—especially the healthy ones—and leaves the insurance pool vulnerable to competitors through price segmentation.
Getting a more complete view of policyholders could lead to significantly different estimates of an individual policyholder’s mortality and behaviors. For example, we developed a simple experimental life expectancy calculator based on Hong Kong mortality data (supplemented with medical research from around the world) to estimate the effect different lifestyle and behavioral changes can have on mortality. We estimated that an average 30-year-old nonsmoking man in Hong Kong can expect to live to 88 years (using standard mortality and mortality improvement assumptions), but this expected value could easily vary by +/− 5 to 15 years with relatively small changes in lifestyle habits (e.g., drinking more than two glasses of alcohol a day, increased consumption of red meat without vegetables, getting divorced and so on). See Figure 2.
Figure 2: Variation in Expected Lifespan Based on Different Lifestyle and Socioeconomic Factors
Your traditional life expectancy: 87.6 years
This is the traditional calculation based on your age, gender and smoking status. Our seasonlab actuarial team has gone through the latest scientific research and made this more fun for everyone. This is our Experimental Life Expectancy Calculator.
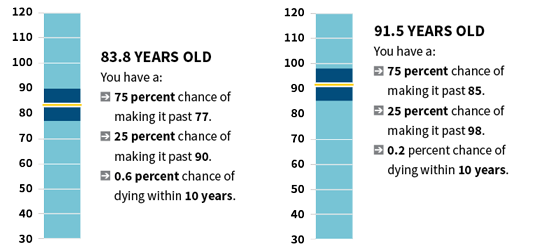
Lifestyle and socioeconomic indicators can have a noticeable impact on one’s life expectancy. We calculated the “traditional” life expectancy (87.6 years) using standard mortality and mortality improvement assumptions. The “experimental” life expectancies (91.5 years and 83.8 years) tested the effects of different lifestyle and socioeconomic indicators (e.g., drinking habits, marriage status, education level and so on).
Our life expectancy calculator considers factors beyond age, gender and smoking status to give the public a general sense of how different lifestyles might affect their health. The calculations are clearly labeled as experimental and should not be interpreted as definitive estimates of individual life expectancies, but they can be a fun and simple reference.
Source: Hong Kong A01 Mortality Table and Seasonalife Analyse
This is just another way of stating an all-too-obvious fact that individual variations in lifestyle habits and genetics can have a profound impact on individual life expectancies, and the divergence increases with time after the insurance company first underwrites the policy.
Ways to Obtain This Data?
An obvious first step is to look for data from within the organization, targeting the data sitting in marketing, underwriting and other databases. Such efforts are well underway across many companies, but the challenges can be formidable given the different systems and data quality issues.
It’s important not to dismiss data outright even if it has some data quality issues. After all, expectations for the necessary data quality vary depending on your intended application. Data that might not be “good enough” for actuarial pricing or valuation might be “good enough” for prototyping pilot projects around inforce management or marketing.
Did You Know?
Studies of mortality among monks and nuns suggest that gender itself isn’t the sole causal driver of morality differences.4 The gender mortality gap we observe might be influenced more by lifestyle and cultural differences.
Male and female mortality are affected quite differently by different relationship statuses. One interesting difference is that males generally suffer higher mortality risk than females after getting divorced.5
Sexual activity is another factor related to one’s mortality risk. While academic research into this area is a bit sparse (we can only guess why), available literature suggests that men with a higher frequency of sexual activity tend to have lower mortality risk,6 although this reverses for advanced ages, while past enjoyment (rather than frequency) is more predictive for women.7 These factors could be confounded with health levels, as the two are hard to separate.
One quick option is to purchase data from vendors that may have collected comprehensive background information on individuals from various sources. Obviously, the data quality, cost and suitability are important considerations when obtaining data in this manner.
Another option is to get data directly from the policyholders. Often, this requires providing some other value to the policyholders in exchange. For example, some insurers have partnered with genetic testing companies and smart device companies to provide additional benefits to their policyholders. Some campaigns under this theme are designed to provide more opportunities for customer engagement, and some might even be considered “marketing gimmicks.”
Customer research reveals that many are coming to accept, if not expect, insurance companies to provide more support and interactions beyond the insurance product, extending toward more personalized services. Providing services and advice, such as managing health and personal finances, can help improve customer satisfaction and, just as important, customer retention.8,9
Simple Games
Simple “games” might be another way for insurance companies to survey their policyholders at little cost. Customers may get defensive when asked about their personal information, such as income level and family medical history. Millennials have much shorter attention spans and have little interest in a lengthy, boring questionnaire, even when it’s the necessary path to comprehensive financial planning.
Obviously, any such surveys would need to be carefully positioned to avoid personal data privacy issues. The goal of games like a “life expectancy calculator” or “retirement readiness calculator” is to get a temperature check on the inforce group. When accompanied by other inforce management programs, they could be used as an inexpensive method of tracking changes and the effectiveness of such programs.
Using such data for more “traditional” actuarial activities will be trickier. We expect that calculators with differing levels of granularity will be offered to meet different needs (e.g., advice based on high-level heuristics versus comprehensive recommendations), and these will generate data at corresponding levels of granularity. The target of such games might also vary among population-level groups and policyholders (depending on where such games are offered and to whom they are made available).
While our expectation is that the initial data will be far from being rigorous enough for actuarial pricing or valuation, we do think that both the data quality and quantity will improve over time, and it will be interesting to explore how this new data can be merged with existing data (e.g., with the company’s own experience data, as well as those from industry studies). The credibility methods actuaries currently use likely will need to be modified. In particular, we note that these “external sources” of data might be more voluminous in quantity, but they are not as directly relevant and are less deserving of high credibility factors.
Regardless of these considerations, the main purpose of these activities is to provide a fun, interactive and gamified experience, where the insurer provides useful information or services to the customer in exchange for data that can be used to help the insurer improve its product and services. This issue is particularly acute as insurance companies have some of the lowest customer engagement scores compared to other industries, including other financial services. Each interaction with a customer is an opportunity to delight or annoy, and currently there are very few opportunities to delight. This is an important issue, as customer engagement and customer satisfaction/loyalty are highly valued.
A possible way to delight customers is to provide more actionable advice about their well-being. Simple calculator recommendations, as shown in Figure 3, generated positive user feedback and very high engagement rates in the calculator’s limited preliminary beta access.
Figure 3: Personalized Recommendation Offered Based on User’s Lifestyle
It is possible to gain 5.2 years of life expectancy if you become a nonsmoker.
It is possible to gain 3.3 years of life expectancy if you become married.
It is possible to gain 2.1 years of life expectancy if you consume 0.5 servings or less of meat and 3 or more bowls of vegetables per day.
These are suggested action items for a 35-year-old smoking male with their potential impacts on the user’s expected lifespan. Such impacts vary with the user’s other lifestyle and socioeconomic indicators.
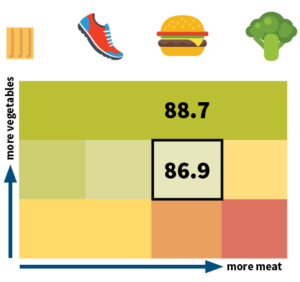
In Figure 4, consuming one more cup of vegetables (equivalent to about 2 servings) each day could extend life expectancy by nearly two years. (These are indicative estimates—not intended for actuarial pricing!)
Figure 4: Possible Life Expectancy Impacts
How does my diet affect my life expectancy?
You consume 1.5 servings of meat and 1–3 bowls of vegetables per day.
Is it possible to gain 1.8 years of life expectancy if you consume 1.5 servings of meat and 3 or more bowls of vegetables per day?
This is a visualization of possible impacts on a user’s life expectancy if he or she adopted different lifestyle habits.
To take a step forward, insurers may even provide incentives to encourage users to act. This sets up a continuous interaction model between customers and the insurance company.
To illustrate the potential benefits, Figure 5 shows an illustrative (simulated) change in the mortality distribution if we’re able to subtly influence policyholders’ lifestyle choices.
Figure 5: Simulated Mortality Distributions Based on Different Lifestyle Indicators
Change in lifestyle creates a noticeable difference in claims experience. The standard mortality chart in yellow shows a simulated mortality distribution of an average 30-year-old nonsmoking male in Hong Kong following standard mortality and mortality improvement assumptions. The changed lifestyle chart in blue shows a simulated distribution assuming certain changes in lifestyle were made (e.g., better eating and exercising habits).
Source: Hong Kong A01 Mortality Table and Seasonalife Analyse
Conclusion
Such value-add interactive services should not be merely treated as marketing campaigns. They offer more than branding and loyalty improvements. The value of firsthand data in the digital age cannot be over-emphasized, especially to insurance companies that take long-term liabilities requiring close experience monitoring.
Changing customer engagement and policyholder behaviors can be a very high-leverage activity for insurers. With large inforce blocks, minor improvements to the block can result in material improvements that can support any cost-benefit analysis at the beginning of such projects, but the challenge is often in taking the first steps when any such estimates are simply “expert judgments.”
Finally, we emphasize that it is important to avoid creating negative discrimination. The aim of reducing cross-subsidization is to reward those bringing improved experience to the company, but not to penalize other policy-holders who may leave feeling discriminated against.
As a simple start, insurers can try to build simpler games to encourage customer interaction. The data collected may not be rigorous enough for a serious experience study or assumption-setting, but with more of these simple games we are able to obtain more information about other aspects of people’s lives, such as lifestyle and preferences that are key parameters in the dynamic modeling of policyholder behaviors for more complex insurance products. Indeed, it’s often when actuaries embark on policyholder behavior studies and step back to get a holistic view of the data that they realize how little they know about their policyholders. As data accumulates, we can use it for real analyses like inforce management—and this is when the investment starts to pay off.
References:
- 1. “Sun Life Financial Announces Industry-Leading Underwriting and Product Changes.” Sun Life Financial. November 21, 2016. https://www.sunlife.ca/ca/About+us/Newsroom/News+releases/Announcement/Sun+Life+Financial+announces+industry-leading+underwriting+and+product+changes?vgnLocale=en_CA&id=123053. ↩
- 2. “Risk and Reward.” The Economist. March 14, 2015. http://www.economist.com/news/finance-and-economics/21646260-data-and-technology-are-starting-up-end-insurance-business-risk-and-reward. ↩
- 3. Practical being a mix of significance and cost. ↩
- 4. Poulain, Michel. “The Longevity of Nuns and Monks: A Gender Gap Investigated With New Belgian Data.” 2012. Presentation, Population Association of America Annual Meeting. ↩
- 5. Va, Puthiery, Wan-Shui Yang, Sarah Nechuta, Wong-Ho Chow, Hui Cai, Gong Yang, Shan Gao, Yu-Tang Gao, Wei Zheng, Xiao-Ou Shu, and Yong-Bing Xiang. “Marital Status and Mortality Among Middle Age and Elderly Men and Women in Urban Shanghai.” PLoS ONE 6, no. 11 (2011). ↩
- 6. Smith, G. D., S. Frankel, and J. Yarnell. “Sex and Death: Are They Related? Findings From the Caerphilly Cohort Study.” BMJ 315, no. 7123 (December 20, 1997): 1641–644. ↩
- 7. Palmore, E. B. “Predictors of the Longevity Difference: A 25-Year Follow-Up.” The Gerontologist 22, no. 6 (1982): 513–18. ↩
- 8. “Insurance Agents are Becoming the Main Purchase Channel for Obtaining Medical Benefit Insurance.” J.D. Power. March 12, 2014. http://www.jdpower.com/press-releases/2014-japan-life-insurance-contract-customer-satisfaction-post-purchase-study. ↩
- 9. Subashini, S., and R. Velmurugan. “Policyholders Satisfaction of Life Insurance Products With Reference to Coimbatore District.” International Journal of Business and Management Invention 5, no. 4 (2016): 28–33. ↩