
The Effects of Heatwaves
A look at heat-related mortality in Europe and South Korea
June 2024Photo: Shutterstock/Marc Bruxelle
According to the European Environment Agency, Europe is the fastest-warming continent in the world, and heat stress is one of the most severe climate risks.1 In 2023, Europe recorded one of its warmest summers in history. Globally, yearly average temperatures continue to rise as well. Many countries are experiencing an increase in their average temperature and temperature volatility, leading to extreme heat or cold. Thus, people are being exposed to more heatwaves, which have a significant impact on human health, as demonstrated by the high number of excess deaths during the European heatwaves in 2003, 2018 and 2022.2,3,4
To analyze the mortality impact of heatwaves, one should first define what a heatwave is, but due to regional variations in temperature, there is no standard definition. Typically, heatwaves are defined by the number of days (duration) with the maximum temperature exceeding a certain threshold. The threshold can be either a fixed value or a percentile of the local temperature distribution.5 It is also important to consider the possibility of delayed effects of extreme heat on mortality.6 For example, heat stress or dehydration may worsen chronic conditions, leading to higher mortality in the weeks following a heatwave.
In this article, we analyze the impact of heatwaves on mortality in selected European countries from 2000-2019 and in South Korea from 2010-2019. We estimate quasi-Poisson regression models7 with actual over expected (A/E) deaths as the target variable and include the number of days in a week with maximum temperatures at or above a fixed threshold to capture the effects of extreme heat duration. We also include one- and two-week lags of extreme heat duration to explore its delayed effects on the mean A/E.
Data Sources
We considered the following groups of countries:
- The DACH countries (Germany, Austria and Switzerland)
- The Benelux countries (Belgium, Netherlands and Luxembourg)
- The Baltic countries (Estonia, Latvia and Lithuania)
- South Korea
Since the land area of Germany is larger than the areas of the other selected countries, the analysis on a national level for Germany would have been less informative and was conducted at the state level instead.
We took the actual weekly deaths from the Short-term Mortality Fluctuations (STMF) data series of the Human Mortality Database (HMD) for all countries except Germany,8 for which we used weekly state-level deaths from the German Federal Statistical Office.9 Thereby, we obtained more data points for Germany and accounted for state variations in temperature. For the European countries, we included weekly mortality data over the period 2000-2019, preceding the COVID-19 pandemic. For South Korea, the STMF weekly mortality data was available only for 2010-2019.
For all countries except Germany, we used the HMD population data at the beginning of a year.10 For Germany, population size at the end of a year for each state was taken from the German Federal Statistical Office,11 and we assumed that population size at the end of a year was equal to population size at the beginning of the next year. Further, we used life tables from the HMD for all countries, including Germany, to compute expected deaths for each country or state in each year with the population size at the beginning of the year and life table of the previous year, which was the newest life table at that time. We divided the expected yearly deaths by 52, removing week 53 where applicable for consistency purposes. Weeks in these data sources are defined according to the ISO 8601 date and time standard.
We used CPC Global Unified Temperature data,12 WorldPop population counts13 and country14 (or German state15) polygons to compute the weighted mean of maximum temperature for each country (or German state) for each day over the period 2000-2019.16 Population counts were used as weights since high temperatures are expected to have a stronger effect on mortality in densely populated areas, as more people are at risk there.
Modeling Approach
We estimated quasi-Poisson regression models to investigate the impact of extreme heat duration on the mean value of actual deaths while accounting for expected deaths in different countries or groups of countries. To this end, the A/E ratio was taken as the target variable and expected deaths as the weight variable. The number of days with maximum temperatures at or above a certain threshold in a given week, one week prior and two weeks prior were included as categorical predictor variables alongside country (for Europe), year, age group and gender. We computed the 95% confidence intervals for parameter estimates using the delta method.17
Since extreme heat events typically occur during the summer months, we restricted the data we used for modeling to weeks 18-40. Higher levels of the extreme heat duration were combined into one category (3+, 4+ or 5+) due to a low occurrence of those levels, and we chose the level of 0 days as the base level in all models.
Extreme Heat in Europe
Figure 1 presents modeling results for the DACH, Benelux and Baltic countries. The maximum temperature threshold used to define extreme heat was set to 30°C, similar to studies analyzing heat-related mortality in Germany and Austria.18,19 The results in the rest of the article are based on the state-level data for Germany and country-level data for the other countries.
Figure 1: Effects of Extreme Heat Duration in the DACH, Benelux and Baltic Countries
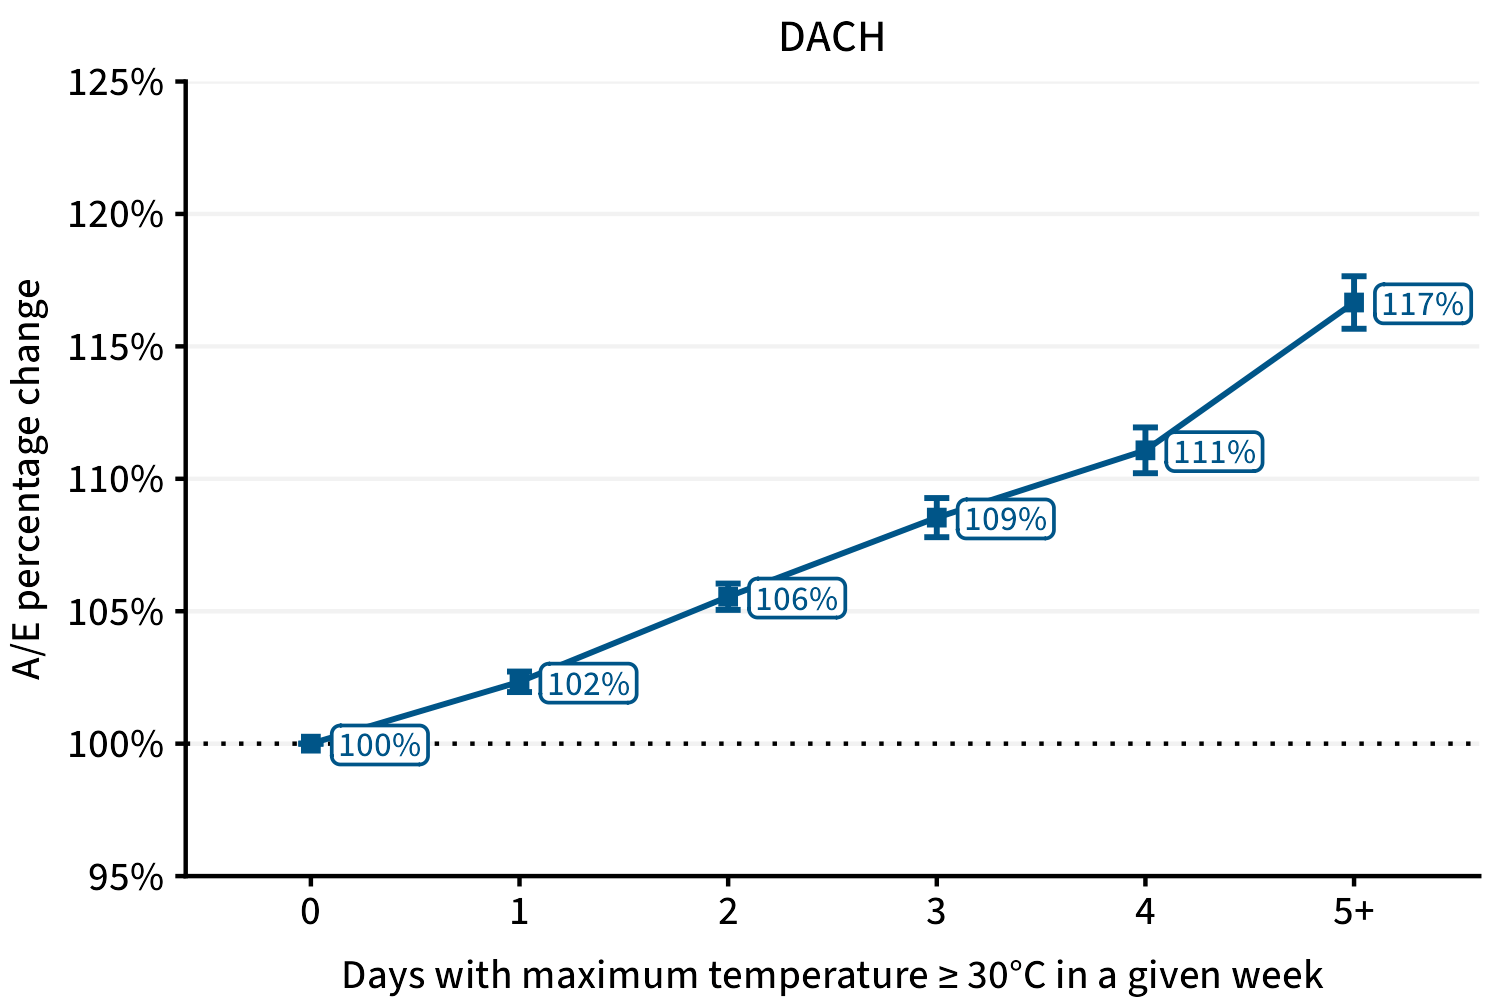
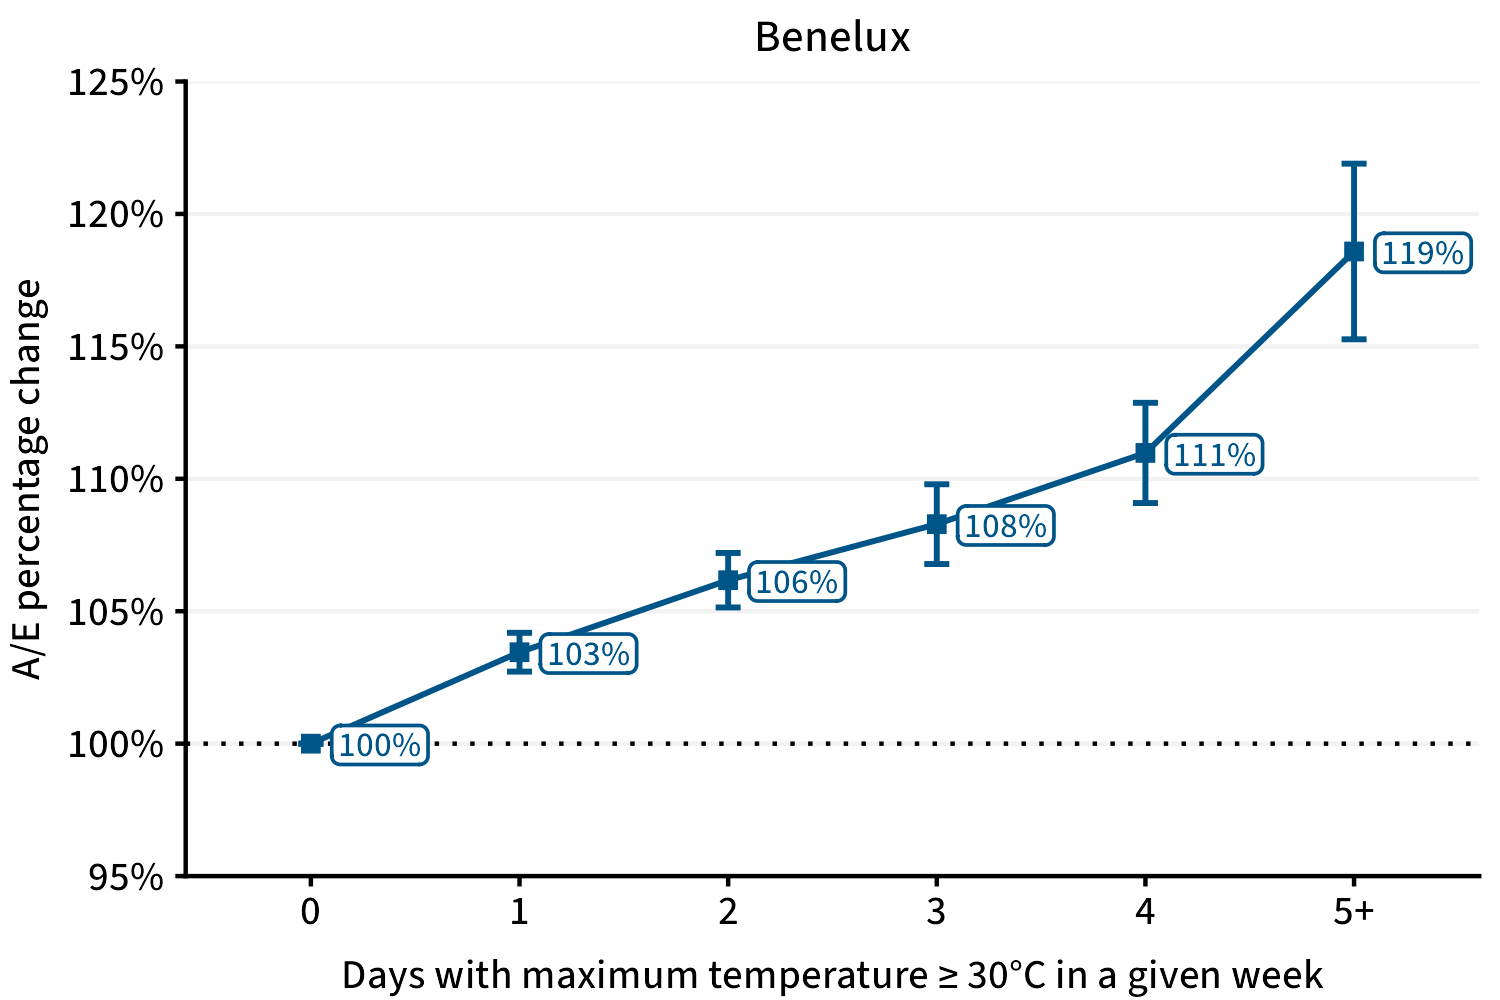
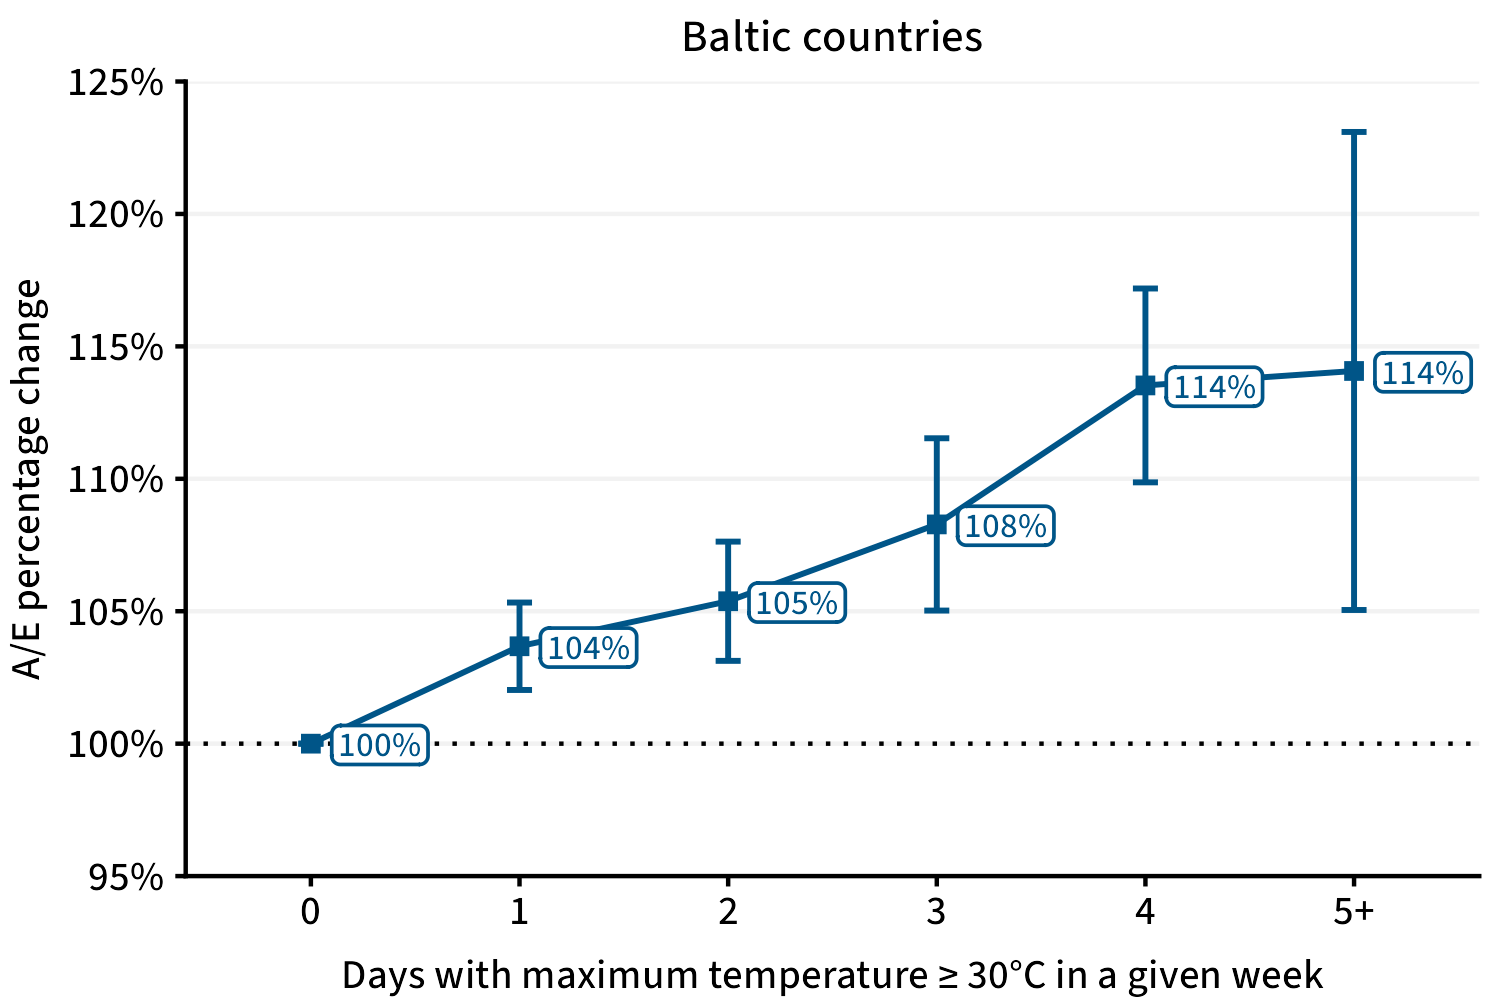
Source: Author visualization of modeling results based on various data sources7,8,9,10,11,12,13,14
Figure 1 shows the estimates of the percentage change in the mean A/E for different levels of extreme heat duration in a given week relative to the base level of 0 days alongside 95% confidence intervals. The effects of extreme heat duration in the three groups of countries show a similar pattern: increasing the duration of extreme heat increases the mean A/E relative to the no-extreme-heat scenario in a given week, with the largest effect taking place when extreme heat lasts four or five or more days. Specifically, in the DACH and Benelux countries, the mean A/E is estimated to be 17% and 19% higher, respectively, when extreme heat lasts five or more days in a given week relative to the no-extreme-heat scenario. For the Baltic countries, the estimated effect of extreme heat lasting five or more days in a given week is of similar magnitude but has high uncertainty associated with it since there was only one week during the period 2000-2019 (week 31 in 2014 in Lithuania) when extreme heat lasted five or more days.
These results are based on an assumption that the effects of enduring extreme heat are the same regardless of which age group we consider. However, studies show that older or very young age, certain chronic conditions, pregnancy and social deprivation are among the risk factors for heat-related adverse health outcomes.20
As insurers, we are particularly interested in whether the effects of extreme heat vary by age group. To this end, we combined data for the DACH, Benelux and Baltic countries, as the effects of extreme heat duration appeared to be similar across these countries, and we included the interactions of extreme heat duration and its lags and age group into the model. Age groups were defined as follows:
- 0 to 64
- 65 to 74
- 75 to 84
- 85 and older
Figure 2 shows the estimates of percentage change in the mean A/E for different levels of extreme heat duration in a given week relative to the base level of 0 days for different age groups. For the age groups 0 to 64, 65 to 74, 75 to 84, and 85 and older, the mean A/E is estimated to be 11%, 12%, 18% and 22% higher, respectively, when extreme heat lasts five or more days relative to the no-extreme-heat scenario in a given week. Overall, the effects of extreme heat duration appear to be most prominent for the oldest age group and least prominent but still significant for the younger age groups of 0 to 64 and 65 to 74 years. These findings are consistent with other research exploring the association between temperature and mortality.21
Figure 2: Effects of Extreme Heat Duration in the DACH, Benelux and Baltic Countries (Combined) by Age Group
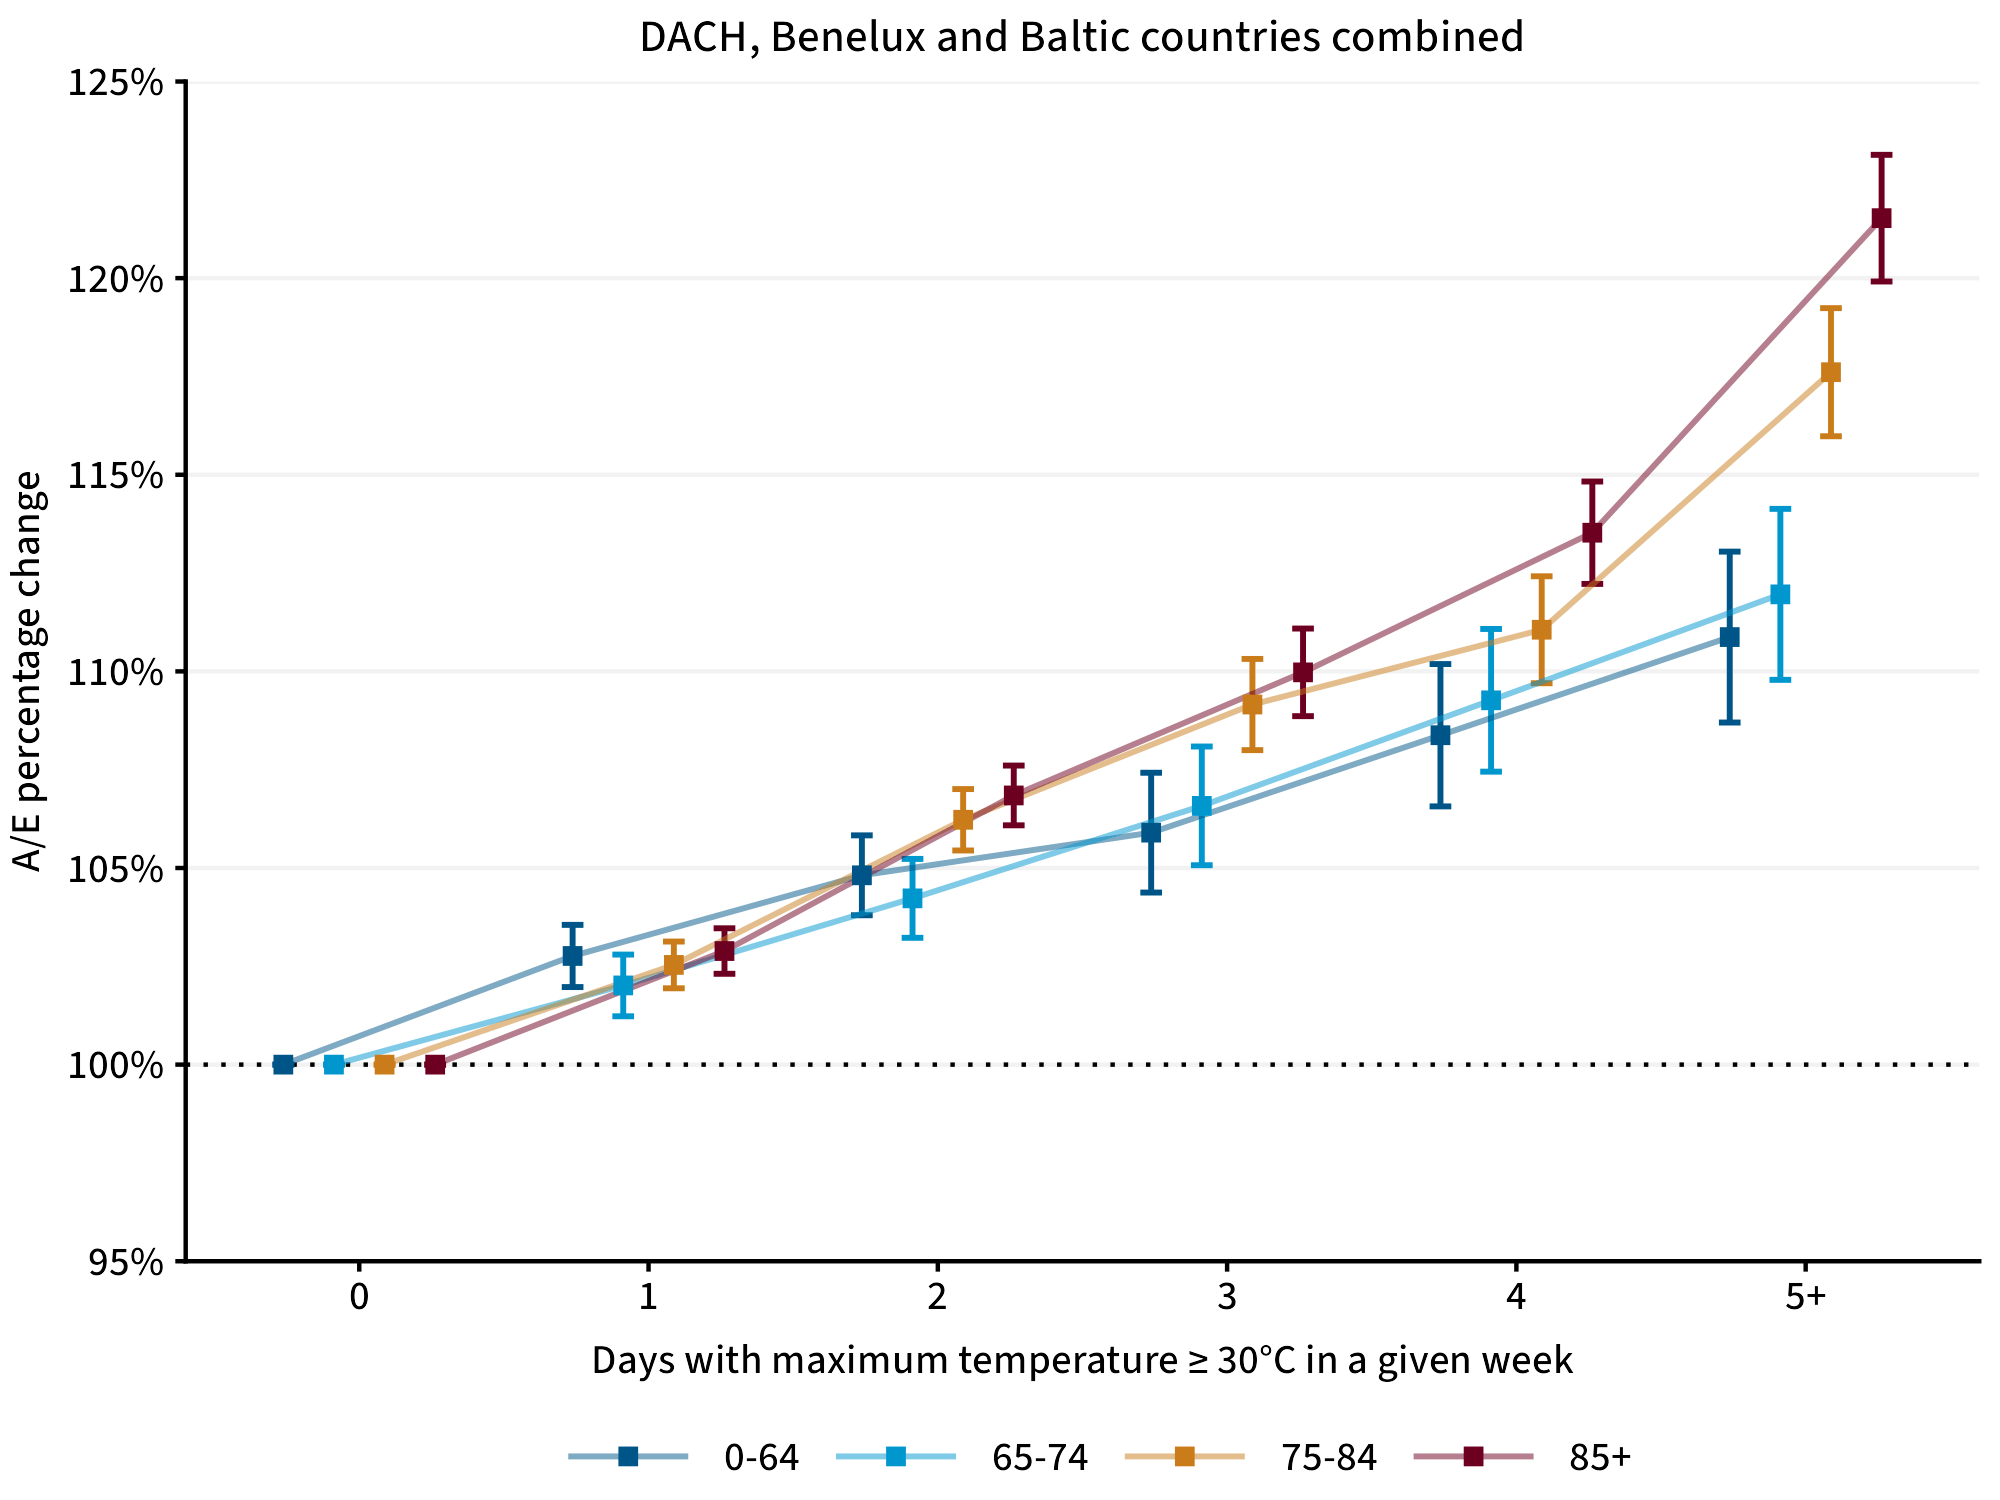
Source: Author visualization of modeling results based on various data sources7,8,9,10,11,12,13,14
We explored the delayed effects of extreme heat by adding the interactions of age group and one- and two-week lags of the extreme heat duration predictor. Increases in the mean A/E in a given week were detected only for the extreme heat duration of five or more days one week prior (3% to 9% depending on the age group), whereas small decreases were detected for the extreme heat duration of one to five or more days two weeks prior. An der Heiden et al. (2020) explained similar findings by the displacement of the time of death by two or three weeks.22
Extreme Heat in South Korea
Figure 3 presents modeling results for South Korea, covering the period from 2010-2019. We used the maximum temperature threshold of 35°C to define extreme heat in South Korea since it is consistent with a threshold the Korea Meteorological Administration uses to issue a heatwave warning.23 We could detect weaker or no effects of extreme heat duration when we used lower temperature thresholds.
Figure 3: Effects of Extreme Heat Duration in South Korea, 2010-2019
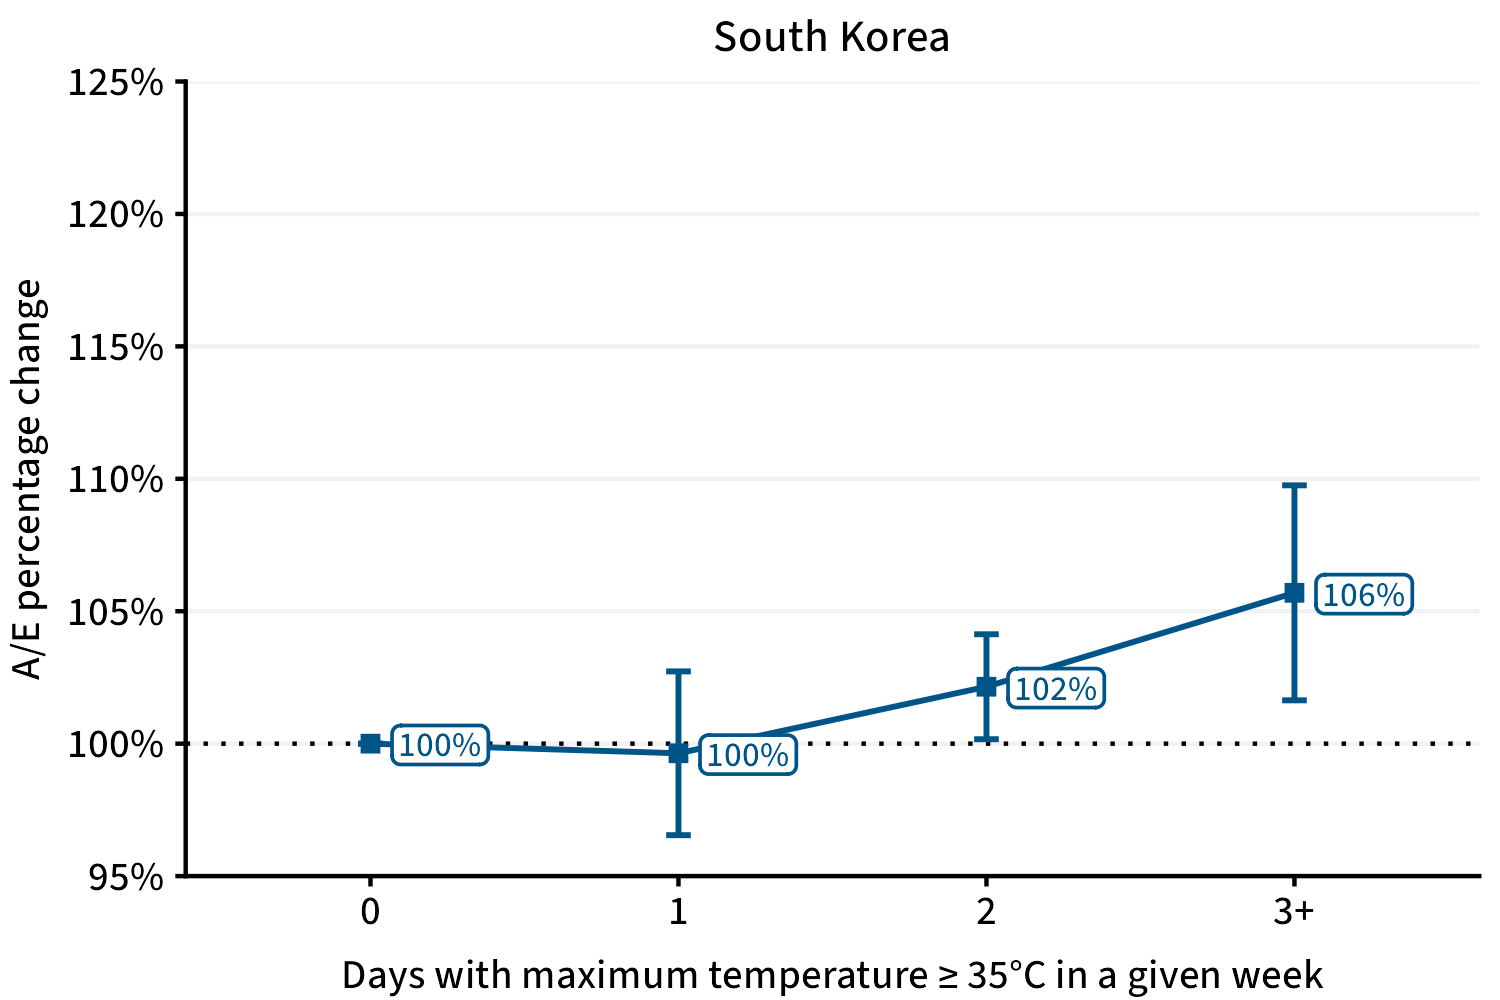
Source: Author visualization of modeling results based on various data sources7,8,9,10,11,12,13,14
Information in Figure 3 shows that the mean A/E is estimated to be 6% higher when extreme heat lasts three or more days relative to the no-extreme-heat scenario in a given week in South Korea. Over the period 2010-2019, extreme heat duration of three or more days was observed on the country level for only two weeks (weeks 31 and 33 in 2018), leading to higher uncertainty associated with the percentage change estimate.
Needing to use different temperature thresholds to define extreme heat for Europe and South Korea can be explained by the violin-box plots in Figure 4. The plots visualize the daily maximum temperature distribution in weeks 18-40 over the period 2010-2019, showing that most of the maximum temperature values for South Korea are concentrated in a higher temperature range and the median maximum temperature is 7°C to 8°C degrees higher than in the selected European countries.
Figure 4: Daily Maximum Temperature Distribution for Selected Countries, Weeks 18-40, 2010-2019
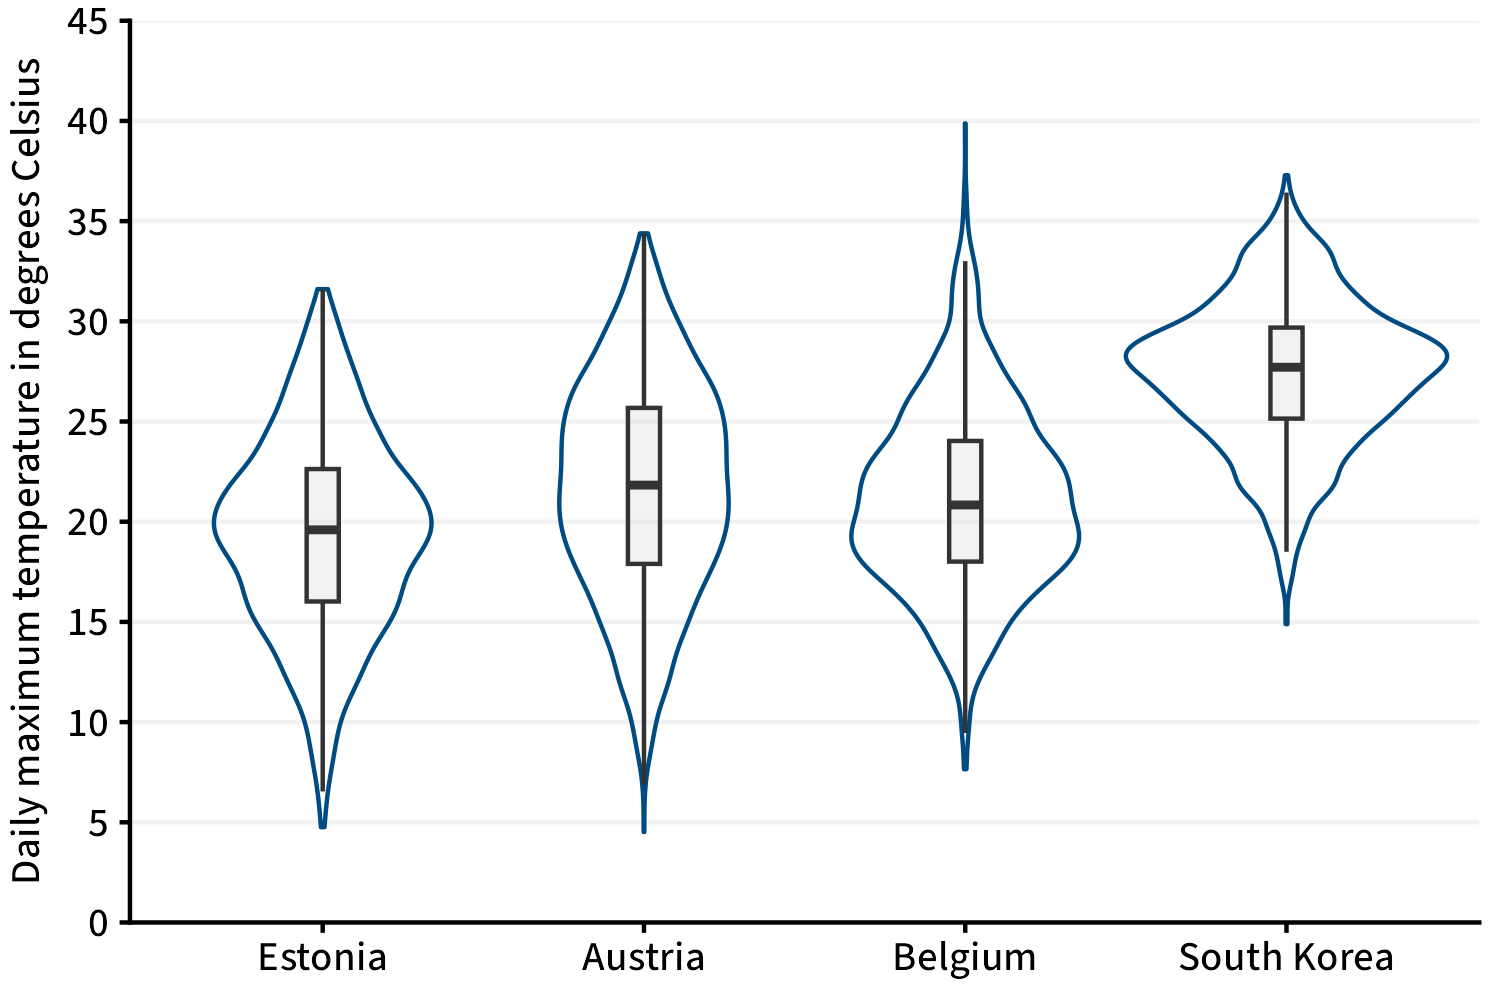
Source: Author visualization of CPC Global Unified Temperature data provided by the NOAA PSL, Boulder, Colorado, United States (accessed March 5, 2024).
The estimated effects of extreme heat duration seem to be slightly weaker in South Korea than in Europe when 30°C and 35°C temperature thresholds are used to define extreme heat in Europe and South Korea, respectively. However, more data will be required to reduce the uncertainty associated with these estimates.
For More Information
- Read the SOA’s Catastrophe & Climate Newsletters.
- Access the SOA’s Excessive Heat Research Collection.
Summary and Outlook
The analysis of the effects of extreme heat duration in selected European countries and South Korea indicates heat that is extreme relative to a local temperature distribution and that lasts sufficiently long in a given week or one week prior could have adverse effects on mortality across all age groups, with the oldest age groups most affected. Additional deaths caused by extreme heat and heatwaves may result in a potential burden for life insurance companies. However, preventive strategies could mitigate the adverse heat effects.24 A natural extension of this analysis could be to also investigate the impact of extreme cold on mortality in the winter months, controlling for the flu effects and accounting for the possibility of longer lags between cold exposure and observed mortality.25
Statements of fact and opinions expressed herein are those of the individual authors and are not necessarily those of the Society of Actuaries or the respective authors’ employers.
References:
- 1. European Environment Agency. 2024. European Climate Risk Assessment. EEA Report No 1/2024. Luxembourg: Publications Office of the European Union (accessed April 3, 2024). ↩
- 2. Robine, Jean-Marie, Siu Lan K Cheung, Sophie Le Roy, Herman Van Oyen, Clare Griffiths, Jean-Pierre Michel, and François Richard Herrmann. 2008. Death Toll Exceeded 70,000 in Europe During the Summer of 2003. Comptes Rendus. Biologies 331, no. 2:171-178. ↩
- 3. Winklmayr, Claudia, Stefan Muthers, Hildegard Niemann, Hans-Guido Mücke, and Matthias An der Heiden. 2022. Heat-Related Mortality in Germany From 1992 to 2021. Deutsches Ärzteblatt International 119, no. 26:451-457. ↩
- 4. Ballester, Joan, Marcos Quijal-Zamorano, Raúl Fernando Méndez Turrubiates, Ferran Pegenaute, François R Herrmann, Jean Marie Robine, Xavier Basagaña, Cathryn Tonne, Josep M Antó, and Hicham Achebak. 2023. Heat-Related Mortality in Europe During the Summer of 2022. Nature Medicine 29:1,857-1,866. ↩
- 5. Xu, Zhiwei, Gerard FitzGerald, Yuming Guo, Bin Jalaludin, and Shilu Tong. 2016. Impact of Heatwave on Mortality Under Different Heatwave Definitions: A Systematic Review and Meta-Analysis. Environment International 89-90:193-203. ↩
- 6. An der Heiden, Matthias, Stefan Muthers, Hildegard Niemann, Udo Buchholz, Linus Grabenhenrich, and Andreas Matzarakis. 2020. Heat-Related Mortality. An Analysis of the Impact of Heatwaves in Germany Between 1992 and 2017. Deutsches Ärzteblatt International 117, no. 37:603-609. ↩
- 7. Agresti, Alan. 2015. Quasi-Likelihood Methods. In Foundations of Linear and Generalized Linear Models, 268-285. Hoboken, New Jersey: John Wiley & Sons, Inc. ↩
- 8. Short-Term Mortality Fluctuations (STMF) data series. Human Mortality Database. Max Planck Institute for Demographic Research (Germany), University of California, Berkeley (United States), and French Institute for Demographic Studies (France), mortality.org (accessed March 15, 2024). ↩
- 9. GENESIS-Online Database of the Federal Statistical Office of Germany. Table 12613-0011: Gestorbene: Bundesländer, Jahre, Geschlecht, GENESIS V5.0.0 RC1 – 2023 (accessed March 7, 2024). ↩
- 10. HMD. Human Mortality Database. Max Planck Institute for Demographic Research (Germany), University of California, Berkeley (United States), and French Institute for Demographic Studies (France), mortality.org (accessed March 15, 2024). ↩
- 11. GENESIS-Online Database of the Federal Statistical Office of Germany. Table 12411-0013: Bevölkerung: Bundesländer, Stichtag, Geschlecht, Altersjahre, GENESIS V5.0.0 RC1 – 2023 (accessed March 14, 2024). ↩
- 12. CPC Global Unified Temperature data provided by the NOAA PSL, Boulder, Colorado, United States (accessed March 5, 2024). ↩
- 13. WorldPop (School of Geography and Environmental Science, University of Southampton; Department of Geography and Geosciences, University of Louisville; Departement de Geographie, Universite de Namur) and Center for International Earth Science Information Network (CIESIN), Columbia University). 2018. Global High Resolution Population Denominators Project – Funded by The Bill and Melinda Gates Foundation (OPP1134076) (accessed March 14, 2024). ↩
- 14. Country polygons for all countries but Germany were retrieved using the R package maps, which imports the world map (updated in 2013) from Natural Earth. ↩
- 15. Federal Agency for Cartography and Geodesy. NUTS Regions 1:250 000. December 31, 2019 (accessed January 29, 2021). ↩
- 16. The R package exactextractr was used to aggregate daily maximum temperature for selected European countries (except Germany) and South Korea as well as 16 German states. ↩
- 17. The R package speedglm was used to fit quasi-Poisson regression models and the car package was used to compute 95% confidence intervals for parameter estimates using the delta method. ↩
- 18. Federal Statistical Office of Germany. Pressemitteilung Nr. N039. Durchschnittlich 1 500 Krankenhausbehandlungen im Jahr bedingt durch Hitze und Sonnenlicht. June 28, 2023 (accessed April 3, 2024). ↩
- 19. Hagen, Manuel, and Philipp Weihs. 2023. Mortality During Heatwaves and Tropical Nights in Vienna Between 1998 and 2022. Atmosphere 14, no. 10:1498. ↩
- 20. European Climate and Health Observatory and the European Climate Adaptation Platform Climate-ADAPT. Heat. Evidence on Climate and Health: Health Effects. March 19, 2024 (accessed April 4, 2024). ↩
- 21. Supra note 6. ↩
- 22. Ibid. ↩
- 23. Korea Meteorological Administration. Criteria for Advisory/Warning Information (accessed April 3, 2024). ↩
- 24. Winklmayr, Claudia, Franziska Matthies-Wiesler, Stefan Muthers, Sebastian Buchien, Bernhard Kuch, Matthias An der Heiden, and Hans-Guido Mücke. 2023. Heat in Germany: Health Risks and Preventive Measures. Journal of Health Monitoring 8, suppl. 4:3-32. ↩
- 25. Anderson, Brooke G., and Michelle L. Bell. 2009. Weather-Related Mortality: How Heat, Cold, and Heat Waves Affect Mortality in the United States. Epidemiology 20, no. 2:205-13. ↩
Copyright © 2024 by the Society of Actuaries, Chicago, Illinois.