The Volatility Regime
Why managed volatility funds exacerbate equity markets correction
February/March 2016Back in August 2015, Standard & Poor’s 500 index lost 11.2 percent in less than 10 days.1 The devaluation of the yuan by the Chinese authorities was surely a catalyst, but technical factors exacerbated the move, including the trading activity of managed volatility funds.
In 2006, Prudential launched the Highest Daily Guaranteed Life Withdrawal Benefit (GLWB). The underlying algorithm used an asset transfer technique, which rebalanced between risky assets (separate accounts—usually actively managed equities funds) and risk-free assets (the fixed-rate account) based on a formula. The formula calculates the distance between the Net Asset Value (NAV) of the funds and the guaranteed curve on a daily basis, taking into account the potential “gap” risk associated with the funds, based on a measure of worst drawdown. Back then, many of Prudential’s competitors mocked the technology and highlighted the risk associated with the asset transfer, namely that of being close to fully delevered from risky assets and locked into the fixed-rate account.
Fast-forward to 2008, when any policyholder would gladly have been repositioned in cash instead of suffering 37 percent losses, which ended up being the performance for the S&P Total Return index that year.2 Thus, Prudential definitely deserved credit for its product design, which protected its policyholders as well as itself. After the crisis, Prudential modified its algorithm by:
- ALLOWING for a three-day rebalance of the portfolio,
- INTRODUCING a 20 percent floor for equities (an increase from 10 percent previously) and
- MOVING into investment-grade bonds as the safe asset versus rebalancing into the fixed-rate account.
The second innovator was arguably AXA, the first firm to introduce volatility target indices, thereby reducing the guarantee-rider cost and the basis risk simultaneously. Volatility targeting at the fund level is a way to control the volatility of the fund, although there will be instances when the rebalancing cannot keep up with corrections in equity markets. Still, the risk management technique mitigated against the whipsaws, i.e., sharp oscillations in the price trajectory of a security, which can be experienced in both short-dated as well as long-dated volatility. Launching volatility-control indices also enabled AXA to reduce the basis risk associated with hedging actively managed funds (traditionally regressed with proxy baskets) with mainstream indices.
However, in my opinion, it was MetLife that revolutionized the industry. While AXA had already used it, MetLife’s Guaranteed Minimum Income Benefit (GMIB) Max—which came out in April 2011 with mandatory election of managed volatility funds—ended up flooding the industry, with 2011 sales totaling $28 billion 3 (not all in GMIB Max). The success was so great (and probably unforeseen) that MetLife terminated its other contract, the GMIB Open (that offered open architecture), and reduced the roll-up rate four consecutive times.
This marked the end of the volatility-target experiment and imposed the volatility-target concept as the new benchmark in variable-annuity (VA) guarantees. Transamerica, Lincoln, AIG, Ameriprise, Nationwide—in fact, all carriers except Jackson National, Pacific Life and Principal Life—have since launched versions of managed volatility funds.
An Inside Look at the Funds
Volatility target funds make tremendous sense. Instead of selling long-dated puts on equity-like actively managed funds, the implied volatility of which can fluctuate widely, VA issuers are locking in their cost of goods sold by virtue of the contract design. Nevertheless, as everyone was proudly announcing their success in transitioning policyholders from open architecture to managed volatility funds on their earnings calls, I started adding up the assets under management (AuM) and thinking:
- If everybody uses the same risk management technique, does that not become counterproductive?
- Specifically, if VA annual sales continued in the $150 billion range, how many years would it take for aggregate AuM to create rebalancing needs that the equity markets simply cannot sustain?
- Did my finance professor not tell us about a 1987 constant proportion portfolio insurance (CPPI) liquidity squeeze?
In listening to more earnings calls and making some election-rate assumptions, I came to $400 billion as of June 30, 2015. My inputs included public earnings calls, as well as estimates and assumptions as to when the managed volatility funds were introduced, the election rate and overall sales of carriers. Annuity Insights4 also produced its own estimates, although its study focused on managed volatility funds and did not include CPPI. Now, I recognize that managed volatility funds come in many flavors. Some fund managers have discretion pertaining to the rebalancing, i.e., they can rebalance intra-day or over several days. Some funds actually own optionality (and underperformed accordingly in 2013–2014 rallying markets); others have caps and floors inside the funds (which actually reintroduce Vega at these points); and a few rebalance intra-day based on implied versus realized volatility. CPPI also differs from this approach, as managed volatility funds could also delever in up markets, which is not the case with CPPI. Ultimately, though, these funds will, in the aggregate, act similarly.
The SPXT10UT Index
So back to August 2015: Equity markets are shaken by concerns around China’s growth. VIX spikes from 13 on Aug. 17, to 40 the following week.5 Managed volatility funds’ algorithms trigger the rebalancing. Barclays Research6 calculated that, assuming two-thirds of the $400 billion tracks Standard & Poor’s 10 Percent Volatility Target Total Return Index capped at 100 percent (SPXT10UT Index),7 managed volatility funds would have sold $45 billion on Aug. 24, 2015, $57 billion on Aug. 25, 2015, and $37 billion on Aug. 26, 2015. That would equate to 9 percent, 16 percent and 11 percent, respectively, of the daily traded volumes for these three days,8 as illustrated in Figure 1.
| Figure 1: Percentage of SPX Futures in Target Volatility Funds (August 2015) | |||
|---|---|---|---|
| Date | Target Volatility Fund Flow (in billions) | SPX Futures (in billions) | % |
| Aug. 24, 2015 | −$44.87 | $502.62 | −9% |
| Aug. 25, 2015 | −$56.71 | $344.30 | −16% |
| Aug. 26, 2015 | −$36.51 | $345.55 | −11% |
Source: Bloomberg, Barclays Research, Sept. 1, 2015
Please recall that the S&P 10 Percent Volatility Control Total Return Index uses the maximum of a short-term and a long-term realized volatility measure for the denominator, and rebalances on the second business day after the rebalancing is triggered. However, I am modifying the S&P 10 Percent Volatility Target Total Return Index algorithm to cap the equity exposure at 100 percent. Indeed, SPXT10UT allows for 150 percent leverage, but most volatility-managed funds do not, hence the modification.
There are other periods of time when the volatility target flows represented an even greater fraction of SPX futures, as shown in Figure 2.
| Figure 2: Percentage of SPX Futures in Target Volatility Funds (2013–2015) | |||
|---|---|---|---|
| Date | Target Volatility Fund Flow (in billions) | SPX Futures (in billions) | % |
| July 1, 2015 | −$47 | $155 | 30% |
| Dec. 22, 2014 | −$29 | $88 | 33% |
| Jan. 28, 2014 | −$61 | $155 | 32% |
| Oct. 14, 2013 | −$53 | $129 | 41% |
Source: Bloomberg, Barclays Research, Sept. 1, 2015
On Oct. 14, 2013, for example, the S&P index rallied 2.2 percent on the expectation that lawmakers would reach an agreement to increase the U.S. debt limit until Nov. 22, 2013, and thereby avoid a U.S. default (Oct. 10, 2013). Large outflow from volatility-managed funds was due to an increase in realized volatility from low levels (below 9 percent). Because we were in a relatively low realized volatility regime, our modified S&P 10 Percent Volatility Control Index had to delever. This illustrates how volatility-managed funds may delever from equities in both sell-offs as well as rallies.
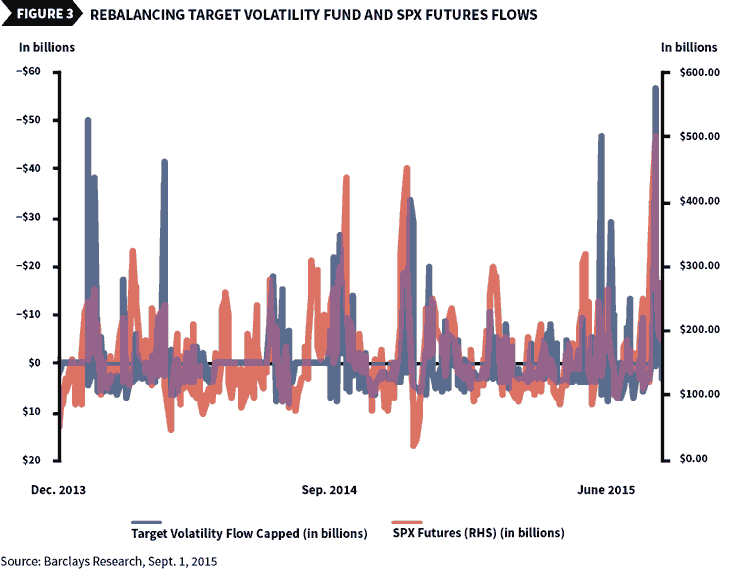
Figure 3 shows the dollar amount of rebalancing flows along with S&P 500 E-mini futures volume over the last year that would have been generated if we assume $275 billion benchmarked to SPXT10UT, capped at 100 percent.
Other Types of Funds
Let’s not forget, however, that there are managed volatility funds outside of VAs. In fact, Annuity Insights estimates $100 billion AuM.9 And recall that Barclays Research used two-thirds of $400 billion as an estimate for its calculation.
What about the risk-free asset class? Most funds rebalance into cash, but for those that rebalance into bonds—even with several rebalance days—we know liquidity has decreased considerably. Now, as you know, bond trading is done over the counter (OTC), which makes it impossible to easily measure the liquidity of these markets. One would need to look at corporate bonds on a single-name basis, the number of daily trades, as well as the average size of these trades, which get reported to Trade Reporting and Compliance Engine (TRACE); however, above certain thresholds ($5 million for investment-grade bonds and $1 million for high-yield bonds), the exact sizes of the trades only get displayed by Financial Industry Regulatory Authority (FINRA) with an 18-month delay. Dealers have been under increased pressure to reduce their leverage ratios and the overall size of their balance sheets. Consequently, they have been reluctant to hold inventory. As such, buying/selling corporate bonds—on an unmatched basis—has become difficult, especially for larger positions.
Looking to the Future
When the Federal Reserve starts normalizing interest rates, volatility in both equities and bonds markets will be affected, triggering rebalancing under the algorithms. We will need to be very aware of the selling pressure to which the managed volatility funds will subject equity markets. Gamma-hedging programs will become crucial in the form of variance swaps and short-dated puts.
Now, what was happening before the advent of volatility target funds? What was different when VA writers were hedging traditional funds with puts? Were the dealers not effectively creating the same selling pressure? VA writers were already rebalancing their deltas during market sell-offs, but the managed volatility funds introduce a compounding effect in the sense that they de-risk when a correction happens, in addition to the insurance carriers re-adjusting their deltas. The de-risking at the fund level tends to be more pronounced, especially when equity’s volatility is realizing low, and the funds tend to be highly invested and potentially levered.
What about the impact on long-dated volatility? Well, volatility-managed funds have definitely dampened demand for volatility past the two-year point. In fact, when looking at Schedule DB’s filings of insurance companies, it appears that 81 percent of Vega traded from June 2014 to June 2015 has a less than two-year tenor, versus 62 percent two years ago10 when many VA writers were still purchasing long-dated puts from dealers. Also, much of the long-dated supply was sourced from institutional investors who were bullish on U.S. equity markets, meaning they were just holding the risk on their books and not actively rebalancing.
Let me also comment on fixed-indexed annuities (FIAs), the sales of which reached $48 billion in 2014.11 I estimate that $10 billion of the $48 billion was invested in FIA crediting strategies tied to volatility-control indices. However, unlike in VAs, where separate accounts are actually invested, FIA policyholders access equity performance through a call option. In turn, only the delta equivalent of the option is effectively invested. Assuming a 50 percent delta for an at-the-money call option, that would be $10 billion times 50 percent, equaling $5 billion.
Finally, many of the recently introduced smart beta indices are already allocated to corporate bonds or treasuries. Thus, the equity exposure will even be less than $5 billion. For example, the Barclays U.S. Dynamic Balance II Index, which has been a crediting strategy alternative for products marketed by Allianz, is exposed to an index replicating the iShares Core U.S. Aggregate Bond Index, in addition to the S&P 500. In light of the foregoing, I do not see these smart beta indices creating technical pressure for now.
LEARN MORE
For more about equity market correction, join us at the Investment Symposium breakout Session 5 “Are U.S. Equity Markets Overvalued?” The day-and-a-half symposium will explore new approaches to portfolio management, as well as cutting-edge research in ALM. The three tracks of study are: portfolio management and strategies; economics, demographics, regulation and technology; and pension and retirement.
For more about integration of volatility-controlled funds into pricing, join us at the Life and Annuity Symposium. The event will take place in May in Nashville.
Browse academic papers on volatility funds by taking advantage of the Investment Section’s EBSCO subscription to peer-reviewed academic papers.
Conclusion
The VA industry needs to continue tracking the growth in volatility-managed funds. The emphasis on investment-only VAs will be essential to decelerate notionals.
Risk managers need to complement their volatility- managed funds with a solid gamma-hedging program, or even better hedging of the gap risk. Hedging a gap event is neither easy nor cheap.
However, some banks, including Barclays, are well-positioned to sell gap risk. Dealers who trade books of autocallable notes, which pay a high coupon but put the end-investors at risk of partial loss of principal, allow banks to recycle the gap risk.
How about going one step beyond volatility control and embedding the gap protection inside the annuity? That would still not change my recommendation to continue tracking AuM in managed volatility funds and assessing just how many of them the equity markets can sustain.
Embedding gap protection inside the contract would require further product development and a third VA generation. In light of all the innovation produced by the insurance industry—from VIX-linked fees and Treasury- linked roll-up rates—I believe distributors are ready to embrace new designs. Especially if these risk management features ultimately benefit policyholders by ensuring that creditworthy carriers are able to honor the lifetime-income feature.
The views expressed are the author’s own and do not necessarily reflect the views of Barclays PLC and its affiliates.
References:
- 1. Bloomberg Aug. 17, 2015–Aug. 25, 2015. ↩
- 2. Bloomberg. ↩
- 3. LIMRA. ↩
- 4. Annuity Insights Oct. 3, 2014. ↩
- 5. Bloomberg. ↩
- 6. Barclays U.S. Equity Derivatives Strategy—Why are VIX Futures Grinding up? Sept. 1, 2015. ↩
- 7. Full Index methodology is available on http://us.spindices.com/indices/strategy/sp-500-daily-riskcontrol-10-usd-total-return-index. ↩
- 8. Barclays, Bloomberg. ↩
- 9. Annuity Insights Oct. 3, 2014. ↩
- 10. Schedule DB, Barclays. ↩
- 11. LIMRA. ↩