
Too Much or Too Little?
How much money is spent on prescription drugs in the United States
May 2020Photo: iStock.com/porcorex
Some people think we spend too much money on prescription drugs in the United States. Others think we spend too little. Why is there such a discrepancy?
Increased compliance and adherence to prescription therapeutic protocols, with the promise of potentially improving health outcomes and reducing the rate of increase in total cost of care, could increase spending on prescription drugs. At the same time, we are spending more in the United States on total health care costs while not achieving proportionately better health outcomes.1 So, how much are we really spending on prescription drugs in the United States, and how is that market structured?
The prescription drug market is made up of a large range of participants, including the manufacturer that produces the drug and the pharmacy that delivers it to the patient—and many other groups fall somewhere in between. The large number of players can make it difficult to understand the overall structure from production to consumption, which in turn makes it challenging to measure the size of the pharmaceutical market. Actuaries help their clients and employers by understanding the market structure and interactions among its participants—they measure and forecast the current and future size of the industry.
Prescription drug spending can be measured in a number of ways. The sections in this article cite a few different sources to provide readers a range of estimates. Note that they are not directly comparable to each other.
- Analysis from the Kaiser Family Foundation based on the National Health Expenditures (NHE) data published by the Centers for Medicare and Medicaid (CMS), which includes only spending on prescription drugs dispensed in the retail setting and excludes drugs administered in hospitals and doctors’ offices.2
- Analysis from the Organization for Economic Co-operation and Development (OECD), where pharmaceutical spending covers expenditures on prescription medicines and over-the-counter products, excluding hospitals and other health care settings. Expenditures calculated include wholesale, retail margin and value-added tax, and are adjusted for possible rebates.3
- Analysis from IQVIA Institute for Human Data Science based on IQVIA proprietary data and estimate of the amount received by pharmaceutical manufacturers after rebates, off-invoice discounts and other price concessions have been made by manufacturers to distributors, health plans and intermediaries.4
- Analysis from Altarum Institute augmenting NHE data by adding an estimated nonretail component based on IQVIA’s report.5,6,7
Both the NHE data and OECD spending data in Figure 1 show that spending on prescription drugs in the United States has increased by about half a percentage point of gross domestic product (GDP) in the last 20 years.
Figure 1: Prescription Drugs: Percentage of U.S. Gross Domestic Product, 2000–2017
Hover Over Image for Specific Data
Sources: Kamal, Rabah, Cynthia Cox, and Daniel McDermott. What Are the Recent and Forecasted Trends in Prescription Drug Spending? Peterson-KFF Health System Tracker, February 20, 2019 (accessed August 6, 2019).
Organisation for Economic Cooperation and Development. 2020. Pharmaceutical Spending (Indicator). (accessed April 5, 2020).
Figure 2 illustrates prescription drug spending as a percentage of total health spending from various sources. For example, in 2016, this can range from 9.9–14.1 percent. Another report that includes nonretail drug markets and profits from other players such as pharmacy benefits managers (PBMs), wholesalers and insurers puts the 2016 estimate closer to 15 percent of total health care spending.8 Despite the sustained growth in prescription drug spending, the proportion of total health care costs has remained relatively constant over the last 20 years. This is due to similar growth rates in nonpharmaceutical health costs in that period.
Figure 2: Prescription Drugs: Percentage of Total Health Spending, 2000–2017
Hover Over Image for Specific Data
Sources: Kamal, Rabah, Cynthia Cox, and Daniel McDermott. What Are the Recent and Forecasted Trends in Prescription Drug Spending? Peterson-KFF Health System Tracker, February 20, 2019 (accessed August 6, 2019).
Organisation for Economic Cooperation and Development. 2020. Pharmaceutical Spending (Indicator) (accessed April 5, 2020).
Roehrig, Charles. A 10-Year Projection of the Prescription Drug Share of National Health Expenditures, Including Non-Retail. Altarum Institute, May 24, 2017 (accessed August 6, 2019).
Roehrig, Charles. Projections of the Prescription Drug Share of National Health Expenditures Including Non-Retail. Altarum Institute, June 29, 2018 (accessed August 6, 2019).
Roehrig, Charles. Projections of the Prescription Drug Share of National Health Expenditures Including Non-Retail—June 2019. Altarum Institute, June 13, 2019 (accessed August 6, 2019).
Although Figures 1 and 2 show that the proportion of prescription drug spending has remained relatively stable, Figure 3 illustrates that prescription drug spending per capita has been increasing at an average annual rate of 3.4–4.9 percent from 2000 to 2017, amounting to around $1,025 to $1,220 per capita in 2017.
Figure 3: Prescription Drugs: Spending Per Capita, 2000–2017
Hover Over Image for Specific Data
Sources: Kamal, Rabah, Cynthia Cox, and Daniel McDermott. What Are the Recent and Forecasted Trends in Prescription Drug Spending? Peterson-KFF Health System Tracker, February 20, 2019 (accessed August 6, 2019).
Organisation for Economic Cooperation and Development. 2020. Pharmaceutical Spending (Indicator). (accessed April 5, 2020).
Medicine Use and Spending in the U.S. IQVIA Institute, May 9, 2019 (accessed August 6, 2019).
After reviewing prescription drug spending over the year, one might wonder how it is allocated among the large range of participants in the market. Figure 4 depicts the findings of researchers who tried to allocate spending across the system by estimating the revenue retained by each market participant.9 Almost two-thirds can be attributed to the manufacturer, as its revenue share includes the cost of product while the remaining share is captured by other participants in the supply chain.
Figure 4: Prescription Drugs: Retained Revenue Across U.S. Pharmaceutical Sector in 2016
Hover Over Image for Specific Data
Structure of Prescription Drug Spending in the United States
Pharmacies
About 90 percent of Americans live within two miles of a drug store. Forty percent of these drug stores are retail chain stores, one-third are independently operated, and the remainder are part of grocery stores, department stores or other businesses. The type of drug store nearest you depends on how large the town is.
Nearly 75 percent of independent stores are located in areas with 50,000 people or less. Due to their location, independent pharmacies often meet the needs of medically underserved populations that face additional barriers to care. These pharmacies often compete more on increasing access rather than decreasing cost—for example, delivering drugs to the door of homebound seniors.
Chain pharmacies tend to compete more on convenience and cost. Generally, there are other competitors nearby, so competitive drug prices help to attract more customers. They also offer other health services like immunizations, wellness screenings and adherence programs, as well as rewards programs to retain customers.
Wholesalers
Wholesalers act as intermediaries between the manufacturers that make the drugs and the pharmacies that dispense them. They buy the medications from the manufacturers, safely transport them to the pharmacies and replenish their inventories. The top three wholesalers in the country, AmerisourceBergen, Cardinal Health, and McKesson, account for nearly 90 percent of the market. Wholesalers provide a service as drug distributors, connecting the manufacturers and pharmacies and making sure that drugs continue to meet the Food and Drug Administration’s (FDA’s) safety standards. Wholesalers typically are paid a percentage of the list price of the drugs they distribute, which means wholesalers get paid more for doing the exact same thing when drug prices go up.
Manufacturers
The pharmaceutical industry discovers, develops, produces and markets pharmaceutical drugs for use as medications. They are subject to a variety of laws and regulations that govern the patenting, testing, safety, efficacy and marketing of drugs. The Pharmaceutical Research and Manufacturers of America (PhRMA) is a trade group that represents many of the pharmaceutical research companies.
The top 10 pharmaceutical companies by global revenue market share in 2018 were:10
- Pfizer (5.6 percent market share)
- Novartis (5.44 percent market share)
- F Hoffmann-La Roche Ltd (4.69 percent market share)
- Merck & Co Inc (4.44 percent market share)
- Johnson & Johnson (J&J) (4.27 percent market share)
- GlaxoSmithKline plc (GSK) (4.19 percent market share)
- Sanofi (4.11 percent market share)
- AbbVie Inc. (3.43 percent market share)
- Bayer AG (2.84 percent market share)
- Eli Lilly and Co (2.57 percent market share)
Generic manufacturers are generally not involved in drug development or discovery. Instead, they focus on the manufacture of drugs after their patents have expired. Some generic manufacturers are part of larger pharmaceutical companies (e.g., Sandoz is a division of Novartis), while others are independent organizations. While most pharmaceutical research is centered in the United States, Europe and Japan, generic manufacturing is done across dozens of countries, with India accounting for the highest level of production.
The top generic manufacturers by net sales in 2018 were:11
- Mylan ($11.26 billion)
- Sandoz—the generics division of Novartis ($9.85 billion)
- Teva Pharmaceutical ($9.67 billion)
- Sun Pharmaceutical Industries ($4.11 billion)
- Lupin ($2.27 billion)
- Cipla ($2.2 billion)
- Hikma Pharmaceuticals ($1.8 billion)
- Sawai Pharmaceutical ($1.77 billion)
- Reddy’s ($1.74 billion)
- Sanofi ($1.69 billion)
Worldwide prescription drug sales in 2018 were $827.8 billion, and this number is expected to be more than $1.1 trillion by 2024. Between 2010 and 2018, the average research and development (R&D) spend to pharmaceutical revenue was 19.8 percent.12 Marketing as a percentage of revenue is not as straightforward, as it can be calculated and accounted for differently by each company. Some findings show a marketing spend that is larger than R&D, while others are lower and some about the same.13
Pharmacy Benefit Managers
PBMs administer prescription drug benefits on behalf of plan sponsors (health plans, self-funded employer plans, government programs, etc.). PBM functions can be bundled into three types of service:
- Administrative services
- Negotiation services (with manufacturers and pharmacies)
- Clinical and fulfillment services (mail pharmacy, specialty pharmacy, infusion pharmacy, etc.)
PBMs have the ability, similar to health plans, to negotiate on behalf of their clients who have millions of enrolled members and they offer various benefit design options intended to help clients save money.
PBMs are different from health plans in that they typically only manage the pharmacy benefit (not the medical benefit). Accordingly, they often can only consider primarily the pharmacy benefit impact and not necessarily the broader impact on total cost of care due to the separation of data when recommending pharmacy benefit design and clinical program decisions. They also typically do not hold any form of insurance risk, though they do take on contractual risks for the achievement of minimum discounts and rebates and for guaranteed performance metrics.
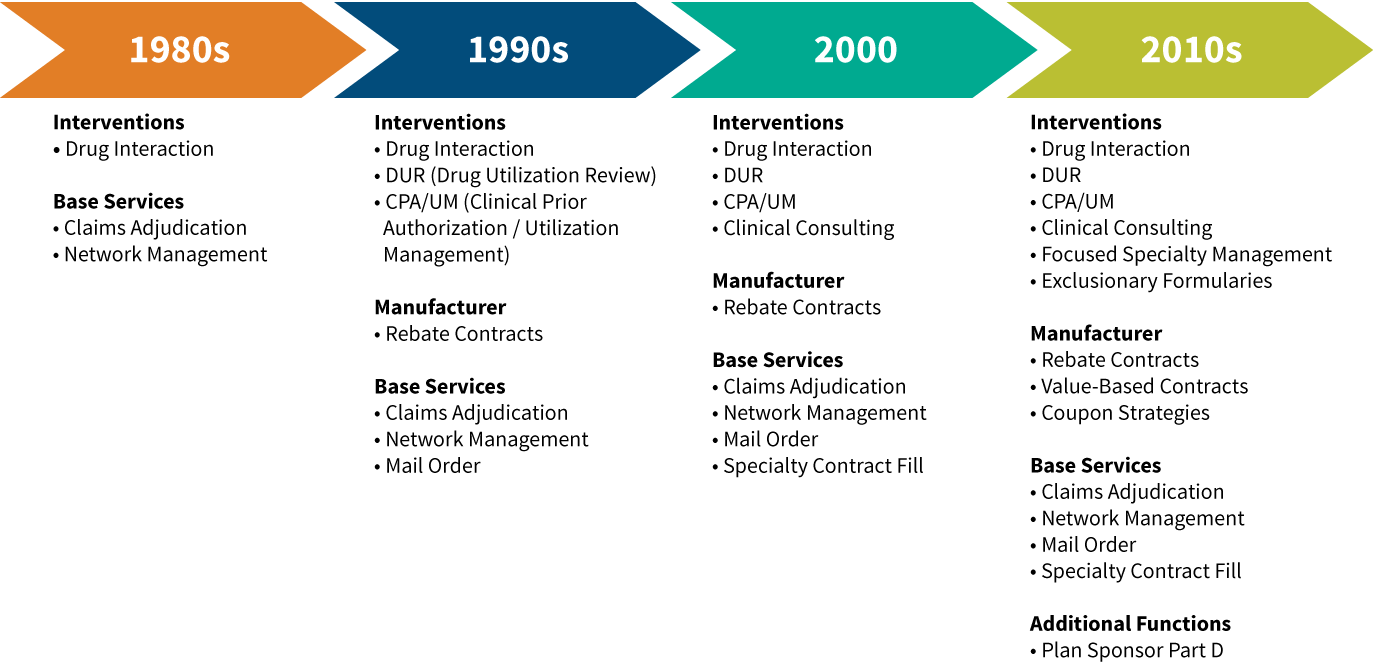
PBM services have evolved over time, as shown in Figure 5:
Figure 5: Evolution of Pharmacy Benefits Manager Service Offerings
The PBM marketplace has consolidated significantly in the 2010s, with the three largest PBMs now administering more than 75 percent of all prescriptions in the United States. In the last few years, each of the largest PBMs has merged with a major health insurer—a surprising shift for an industry that initially started by carving prescription drug management away from traditional health insurance companies. The largest PBMs as of 2018 are shown in Figure 6.14
Figure 6: 2018 Pharmacy Benefits Manager Market Share and Key Health Plan Clients
Hover Over Image for Specific Data
Source: Fein, Adam J. The 2019 Economic Report on U.S. Pharmacies and Pharmacy Benefit Managers. Drug Channels Institute, March 2019.
Note: In 2012, the top three PBMs processed 55 percent of prescriptions. In 2018, the top three PBMs processed 76 percent of prescriptions.
Conclusion
Understanding costs in the pharmaceutical industry requires us to carefully measure the total amount of spending and follow the different cost components. Additional research can help determine which market participants ultimately are receiving the resources flowing into the pharmaceutical industry and what those resources ultimately are achieving. The role of actuaries in this system is to increase the level of transparency of where funds are flowing, to understand and encourage competition within each category of market participant and, ultimately, to work toward solutions that align the incentives of market participants to invent new medications, effectively deliver existing drugs and slow the rate of growth in the total cost of health care.
References:
- 1. Initiative 18|11: What Can We Do About the Cost of Health Care? 2019. Society of Actuaries and Henry J. Kaiser Family Foundation (accessed April 27, 2020). ↩
- 2. Kamal, Rabah, Cynthia Cox, and Daniel McDermott. What Are the Recent and Forecasted Trends in Prescription Drug Spending? Peterson-KFF Health System Tracker, February 20, 2019 (accessed August 6, 2019). ↩
- 3. Organisation for Economic Cooperation and Development. 2020. Pharmaceutical Spending (Indicator). (accessed April 5, 2020). ↩
- 4. Medicine Use and Spending in the U.S. IQVIA Institute, May 9, 2019 (accessed August 6, 2019). ↩
- 5. Roehrig, Charles. A 10-Year Projection of the Prescription Drug Share of National Health Expenditures, Including Non-Retail. Altarum Institute, May 24, 2017 (accessed August 6, 2019). ↩
- 6. Roehrig, Charles. Projections of the Prescription Drug Share of National Health Expenditures Including Non-Retail. Altarum Institute, June 29, 2018 (accessed August 6, 2019). ↩
- 7. Roehrig, Charles. Projections of the Prescription Drug Share of National Health Expenditures Including Non-Retail—June 2019. Altarum Institute, June 13, 2019 (accessed August 6, 2019). ↩
- 8. Yu, Nancy L., Preston Atteberry, and Peter B. Bach. Spending on Prescription Drugs in the U.S.: Where Does All the Money Go? Health Affairs, July 31, 2018 (accessed August 6, 2019). ↩
- 9. Ibid. ↩
- 10. The Top Ten Pharmaceutical Companies by Market Share in 2018. Pharmaceutical Technology, March 7, 2019 (accessed August 6, 2019). ↩
- 11. Saha, Tiash. The World’s Biggest Generic Pharmaceutical Companies in 2018. Pharmaceutical Technology, April 3, 2019 (accessed August 6, 2019). ↩
- 12. World Preview 2019, Outlook to 2024. EvaluatePharma, June 2019. ↩
- 13. Brennan, Zachary. Do Biopharma Companies Really Spend More on Marketing Than R&D? Regulatory Affairs Professionals Society, July 24, 2019. ↩
- 14. Fein, Adam J. The 2019 Economic Report on U.S. Pharmacies and Pharmacy Benefit Managers. Drug Channels Institute, March 2019. ↩
Copyright © 2020 by the Society of Actuaries, Chicago, Illinois.