
Understanding Social Security’s Long-Term Fiscal Outlook
Putting the U.S. Social Security program’s financial challenges in perspective
April/May 2016The Social Security program faces a substantial financing challenge for the future, largely due to demographic changes that have been long known and understood. This article will explain the nature and reasons for this projected imbalance and provide context to better understand the implications for changes that will be needed. See Preserving Reserves for an article that addresses legislative changes that have been considered to address the financing challenges.
Social Security is financed primarily with payroll taxes, which are invested daily into the trust funds, allowing payment of scheduled benefits from these trust funds. Because the program has no borrowing authority, the trust funds must maintain positive reserves. These reserves rise and fall when incoming revenue exceeds or falls short of outgo to pay benefits. Whenever the reserves begin to decline and approach depletion, Congress must act to make timely adjustments. Such adjustments in tax rates and scheduled benefit levels always have been made throughout the 80-year history of the program.
Projected imbalance between scheduled revenue and cost
On a combined basis, the two Social Security Trust Funds, Old-Age and Survivors Insurance (OASI) and Disability Insurance (DI), ran cash-flow surpluses (non-interest income exceeded expenditures) from 1985 through 2009. As a result, the combined OASI and DI Trust Fund reserves grew substantially, reaching more than 350 percent of the annual cost of the program, as shown in Figure 1. This growth was a direct result of the Social Security Amendments of 1983, which substantially improved the financial status of the program for decades into the future.
Figure 1: Social Security Trust Fund Ratios (Assets as a Percentage of Annual Cost)
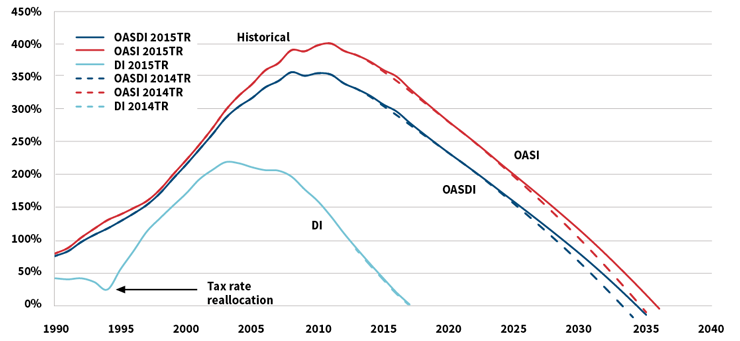
Source: Intermediate Projections from the 2014 and 2015 OASDI Trustees Reports
However, due to long understood and anticipated demographic trends, plus the recent recession, expenditures began to exceed non-interest income for the program in 2010. In the absence of legislative changes, expenditures will continue to exceed non-interest income, and by 2020 expenditures will exceed total income (including interest), requiring redemptions from the trust fund reserves in order to pay the scheduled benefits in full and on time. Based on the intermediate assumptions of the 2015 OASDI Trustees Report, we project that the reserves of the combined trust funds will become depleted in 2034, at which point actual expenditures would be limited to the continuing income to the program. This is because the law does not allow the trust funds to borrow in order to finance scheduled benefit payments. Figure 2 illustrates the reduction in expenditures that would be required starting in 2034 if Congress does not act to correct the imbalance for the entire Social Security program. In 2034, continuing tax revenue would be sufficient to cover 79 percent of the full scheduled benefits on a timely basis, requiring reductions or delays in benefit payments.
Figure 2: Projected OASDI Cost/Expenditures and Income (as a Percentage of Taxable Payroll)
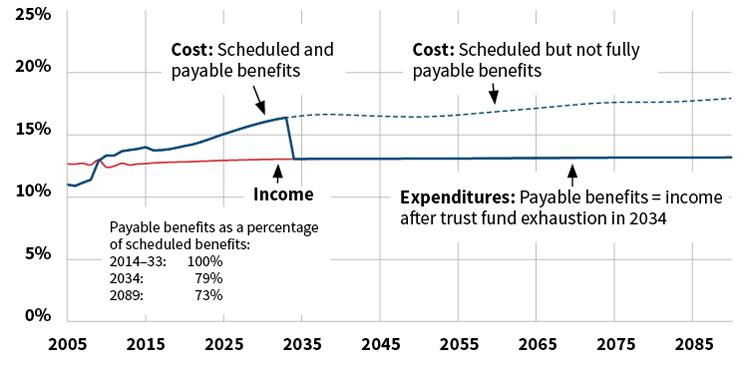
Source: 2015 OASDI Trustees Report Intermediate Assumptions
For the DI Trust Fund alone, reserve depletion was projected to occur much sooner, in December of 2016, until the recent passage of the Bipartisan Budget Act of 2015. This new law provides for a temporary reallocation of a portion of the OASI payroll tax to the DI fund. As a result, DI Trust Fund reserve depletion is now projected for mid-to-late 2022.
Adjustments needed to reduce or eliminate the imbalance
Because the Social Security program (OASI and DI combined, or OASDI) is financed on a pay-as-you-go basis, the age distribution of the adult population is the most important determinant of the level of payroll tax needed to provide any desired benefit level.
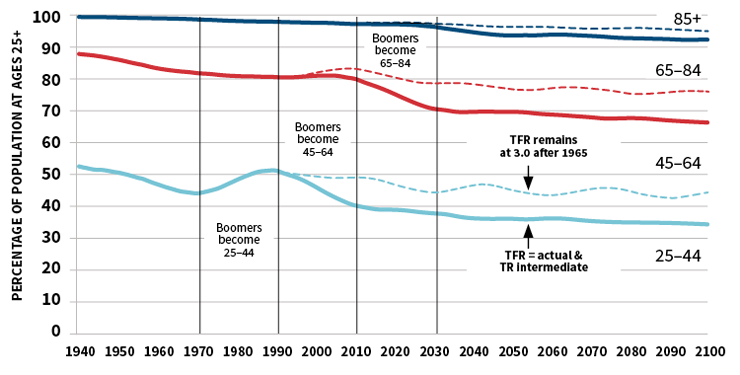
Figure 3 illustrates that the share of the adult population that is over age 65 was essentially flat at 20 percent from 1970 until 2008. As the baby boomers (born in 1946 through 1965) move into retirement age, the share of the adult population over age 65 will grow to 30 percent. As a result, Congress will need to change the law to increase scheduled tax rates, decrease scheduled benefit levels or adopt some combination of these two solutions.
Figure 3: Age Distribution of the Population Age 25+, 1940–2100
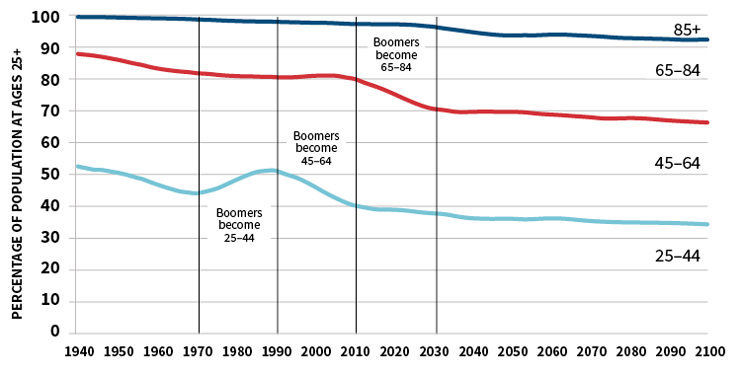
Source: 2015 OASDI Trustees Report
The changing age distribution also illustrates why DI cost as a percentage of payroll has grown between 1980 and 2010, but will stabilize in the future. The share of the working-age population (ages 25 to 64) that is over age 45, where disability prevalence is higher than at younger ages, has grown dramatically as the baby boomers have aged.
This aging of the population is largely due to the drop in birth rates that occurred after 1965, as shown in Figure 4. During the baby boom years, the average birth rate in the United States was 3.3 children per woman on a lifetime basis. In fact, adjusting for survival of children to age 10, the overall birth rate averaged nearly 3.0 children per woman from 1875 to 1965. The dramatic change in the age distribution reflects this drop from an average birth rate of 3.0 children per woman until 1965 to 2.0 children per woman after 1965. The effect is clear when we consider that in the future there will be two children of working age per retirement-age couple, rather than the three children there were in the past.
Figure 4: U.S. Total Fertility Rate (TFR) With and Without Adjustment for Survival to Age 10
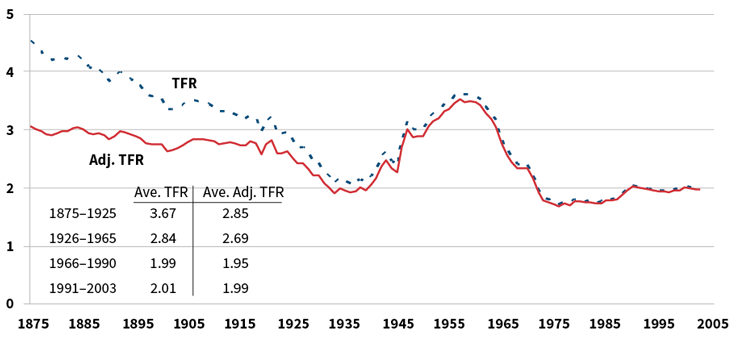
Source: Unpublished data from the Office of the Chief Actuary, U.S. Social Security Administration
The effect of the drop in birth rate on the age distribution can be seen even more strikingly in the aged dependency ratio, which is the ratio of the population over age 65 to the working-age population between ages 20 and 64. If birth rates had remained at 3.3 or even 3.0 children per woman after 1965, the aged dependency ratio would not shift significantly over the next 20 years. The rise in the ratio due to reductions in death rates would be more gradual, and OASDI financial imbalances would be far lower. See Figure 5 for reference.
Figure 5: Age Dependency Ratio of the Population: 65+ to 20–64
Source: 2015 OASDI Trustees Report and calculations from the Office of the Chief Actuary, U.S. Social Security Administration
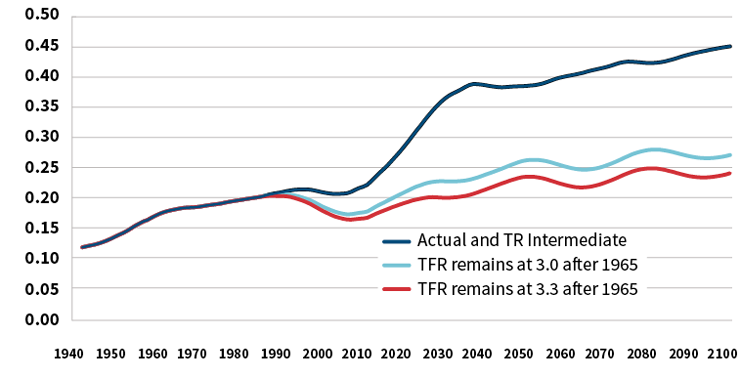
Similarly, the overall changes in the age distribution of the adult population would have been far less dramatic if the birth rate had remained at 3.0 children per woman. The increase in the share of the working-age population most at risk for disability (those over age 45) between 1980 and 2010 would not have occurred. In addition, the dramatic increase in the share of the adult population over age 65 between 2010 and 2030 would not be occurring, as shown in Figure 6.
Figure 6: Age Distribution of the Population Age 25+, 1940–2100: What if the Birth Rate (TFR) Had Remained at 3.0?
Source: 2015 OASDI Trustees Report and calculations from the Office of the Chief Actuary, U.S. Social Security Administration
It is important to keep in mind that we would have different challenges if birth rates had remained high in the United States. We need to adjust our thinking from past concerns about overpopulation to the new reality of a sudden change in the age distribution of the population due to the drop in birth rates.
Remedying OASDI’s fiscal shortfall for 2034 and beyond will require a roughly 25 percent reduction in the scheduled cost of the program, a 33 percent increase in scheduled tax revenue or a combination of these changes. Adjusting the Social Security retirement age for changes in longevity—after the scheduled increase to age 67 is complete—would eliminate only about one-fifth of the shortfall over the next 75 years. Other adjustments to scheduled tax and benefit levels that address the changing age distribution will be needed.
Increases in longevity are difficult to project, and opinions vary. The Trustees’ projections for declines in death rates have been generally quite accurate. However, recent experience from 2009–2013 has shown little reduction in death rates, less than was assumed in recent Trustees Reports. We will continue monitoring this trend carefully.
Note that the age-sex adjusted death rates in Figure 7 represent what the overall death rate would be at ages 65 and older, if the age-sex distribution of the population always stayed the same as it was in 2010. Such adjustment provides a pure indication of change in death rates, unaffected by changes in the age and sex distribution of the population.
Figure 7: Mortality Experience: Comparison of Recent Data and Near-Term Projections
Age-sex adjusted death rates (ages 65 and older)
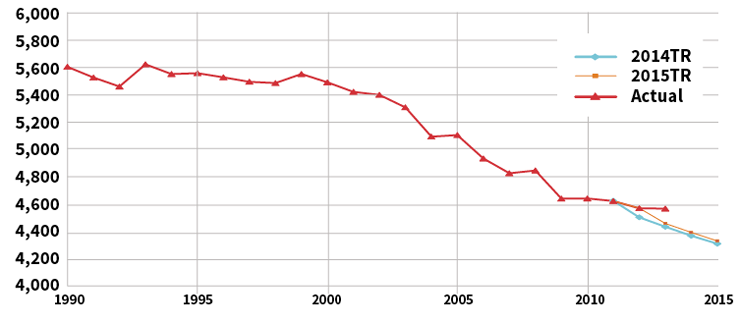
Source: 2014 and 2015 OASDI Trustees Reports
Implications of the Social Security imbalance
From 1985 through 2009, when Social Security was building trust fund reserves, these reserves were invested in special-issue Treasury securities, as required by law. During that period, this trust fund investment meant that the Treasury Department needed to borrow less from the public than otherwise would have been required to cover the on-budget annual deficits. Currently the OASI and DI Trust Funds hold $2.8 trillion in reserves, which are a portion of the roughly $19 trillion in total federal debt subject to limit.
Between now and 2034, as the OASI and DI Trust Fund reserves are drawn upon to support full payment of scheduled benefits, redemptions of the reserves will mean that the Treasury will need to issue additional debt held by the public. However, the total publicly held debt in 2034 would be no greater than if the trust funds had not invested the $2.8 trillion in Treasury securities up to this point.
A far more fundamental consideration is that the trust funds have no borrowing authority. As a result, either fund would be unable to pay full scheduled benefits once it has depleted its reserves. If the combined OASI and DI reserves were to deplete in 2034, then expenditures would be limited to continuing tax revenues for the program. This means that the trust funds cannot exert any pressure on unified budget balances after reserve depletion.
This is a critical point, because under the budget scoring convention used by the Congressional Budget Office (CBO) and the President’s Budget, the OASDI program and the Medicare Hospital Insurance (HI) program are presumed to continue paying full scheduled benefits after reserve depletion, through transfers from the general fund of the Treasury (see Figure 8). These presumed transfers are not permissible under the law, and there is no precedent in the history of these programs for addressing imbalances with transfers from general revenue. Any presentations of projected federal deficits and federal debt held by the public should be accompanied with a presentation showing what will happen under current law and what is consistent with all past experience—where shortfalls after trust fund reserve depletion have been eliminated with changes in scheduled tax rates and benefit levels. In either case, the trust fund has no effect on publicly held debt after reserve depletion.
Figure 8: Social Security Trust Fund Effect on Federal Debt Measures: 1957–2085
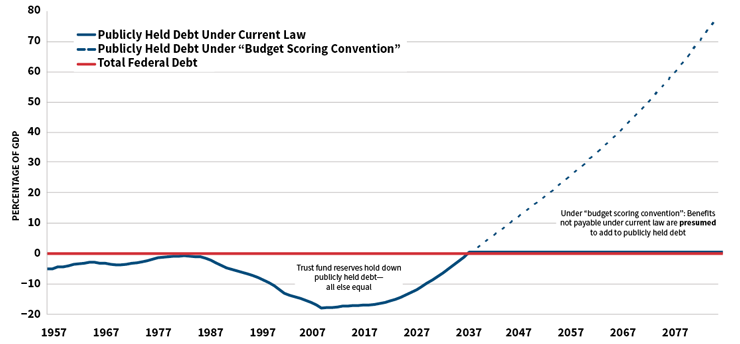
Source: 2010 OASDI Trustees Report Intermediate Projections
For this purpose, Figure 9 shows:
- The projected long-term level of federal publicly held debt in the 2015 CBO long-term baseline under the standard budget scoring convention;
- The projected level of publicly held debt, adjusted to not presume a change in law allowing automatic general revenue transfers to OASDI after reserve depletion; and
- The projected level of publicly held debt, adjusted to not presume a change in law allowing automatic general revenue transfers to OASDI and HI after reserve depletion.
Figure 9: Projected Federal Debt Held by the Public: 2015 CBO Baseline, Assuming OASDI and HI Unfunded Obligations are Paid by Borrowing from the Public Versus Assuming Current Law
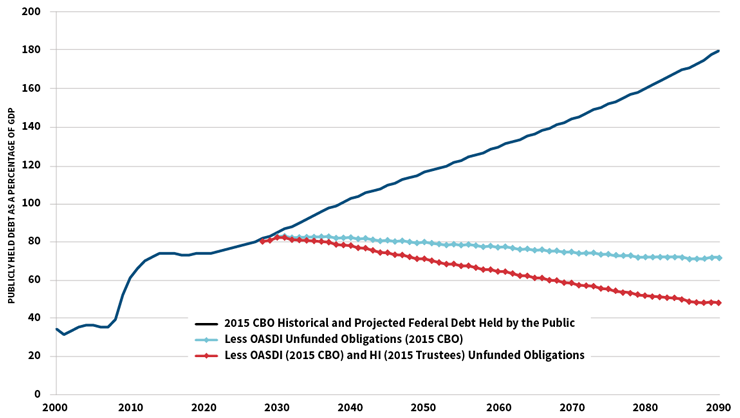
Sources: 2015 Congressional Office Budget, 2015 OASDI Trustees Report
The adjusted levels remove from the projection of publicly held debt the shortfalls for OASDI and HI after reserve depletion. This is an extremely important distinction, as the standard depiction of publicly held debt (shown in Figure 9 from CBO) makes an implicit assumption that any OASDI or HI shortfall will be met by a change in law that would finance the shortfall with general revenue transfers, requiring massive additional borrowing from the public. This depiction is misleading because OASDI and HI shortfalls have always been met with changes in taxes or scheduled benefits that have not required general revenue transfers. Given that current law does not permit the general revenue financing presumed in the budget scoring convention, and that there is no precedent in the 80-year history of these programs for such funding, any illustrations using the budget scoring convention should be qualified clearly.
We based the shortfalls for OASDI on data publicly available from CBO on its 2015 long-term projections. We based the shortfalls for HI on the Trustees’ 2015 projections. By removing the presumed increases in publicly held debt for OASDI and HI after reserve depletion, we see that the projected publicly held debt, reflecting assumed operations of the rest of the federal government, actually declines substantially after 2030 and never reaches 100 percent of gross domestic product (GDP). The overall declining level of debt is notable. This means that the projected operations of the federal government—other than OASDI and HI—are projected to be in balance, or even surplus.
Members of Congress and the public should understand that projected federal debt and budget deficits will not continue to increase under these assumptions, and will in fact decline if current law is followed for OASDI and HI. In addition, the projection of publicly held debt will be the same as under current law if, as has always occurred in the past, trust fund reserve depletion is addressed by a combination of scheduled tax increases and scheduled adjustments to benefits—and not by providing general revenue transfers that would necessitate large amounts of borrowing from the public.