
What Is the Price Anyway?
By understanding the drug pricing process, actuaries can help develop new payment methods in a world of rising drug costs
May 2020Photo: iStock.com/Gearstd
When contemplating the economic impact of prescription drug prices in the United States—and how they contribute to the 18|11 gap between the portion of GDP that health care costs comprise in the United States (18 percent) vs. other global comparison nations (11 percent)—it is important to understand how prescription drug prices are measured. It is also helpful to explore drug pricing approaches applied in the United States compared to those used in other countries.
In their work with payers and other clients, actuaries develop the in-depth knowledge required to understand drug pricing approaches and the different terms and definitions used by manufacturers, pharmacy benefits managers (PBMs), pharmacies and payers. By understanding the entire drug pricing process from start to finish, actuaries can bring a holistic view that allows them to understand the incentives of market participants and how the different components of drug prices interact. With that understanding, actuaries are uniquely equipped to contribute to increased transparency, more competition, better aligned incentives among the various stakeholders and resultant mitigation of the increases in total cost of care for health in the United States.
Measuring Prescription Drug Prices—Prescription Drug Supply Chain: Flow of Products and Funding
Many players are involved in the supply and funding of drugs to consumers in the United States. Figure 1 illustrates the major players, flow of product and funding.1 Services represent contractual relationships between entities. Rebates are payments from manufacturers to pharmaceutical benefit managers. Chargebacks are payments from manufacturers to distributors. Retailers include pharmacies, hospitals, group purchasing organizations and mail-order programs.
Figure 1: Flow of Funds for Single-source Brand-name Drugs Purchased at a Retail Pharmacy and Managed by a Pharmacy Benefit Manager for an Employer’s Health Plan
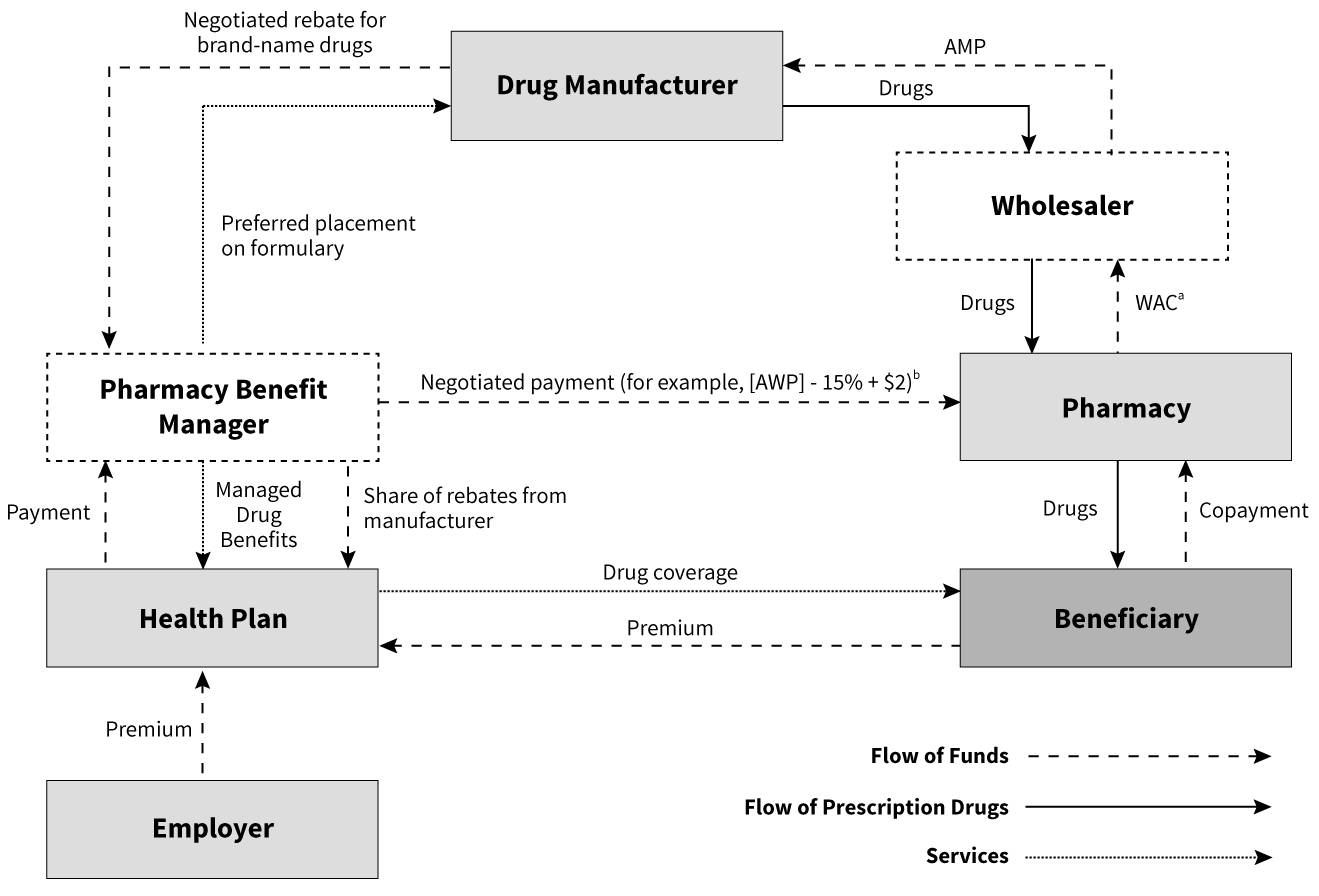
Source: Congressional Budget Office
Note: AWP = average manufacturer price; WAC = wholesale acquisition cost; AWP = average wholesale price
a. The WAC is a list price that approximates what conventional pharmacies pay wholesalers for single-source brand-name drugs.
b. Based on Novartis Pharmaceuticals Corporation. 2004. Pharmacy Benefit Report: Facts & Figures, p. 16.
Pharmacy Pricing: Manufacturers, Wholesalers and Pharmacies
Wholesale Acquisition Cost (WAC)
Despite its name, WAC does not represent the actual sale price of a drug from the manufacturer to the wholesaler. This is the published price that manufacturers provide wholesalers or direct purchasers before any negotiated adjustments. Examples of adjustments include bulk purchasing discounts, prompt payment discounts and distribution fees.
For brand-name drugs, there is less room for negotiations and wholesalers purchase based on discounted rates off WAC. The wholesalers then sell to pharmacies based on WAC with a negotiated markup, thus earning a spread.
For generics, there is more room for negotiations depending on the relative market share of the manufacturer and retail pharmacies, and the resulting price is more elastic.
Average Manufacturer Price (AMP)
If WAC can be understood as the starting point of negotiations between manufacturers and wholesalers, AMP can be understood as the end point, the final sale price after most adjustments have been accounted for.
In 42 C.F.R. § 447.504, the Centers for Medicare and Medicaid Services (CMS) defines AMP as “the average price paid to the manufacturer for the drug in the United States by wholesalers for drugs distributed to retail community pharmacies and retail community pharmacies that purchase drugs directly from the manufacturer.” CMS requires manufacturers to report AMP and publicly post them. Based on AMP, CMS calculates the required manufacturer rebates for Medicaid programs.
However, even though it reflects most rebates and adjustments paid by manufacturers to wholesalers and retailers, it does not include certain items such as prompt pay discounts to wholesalers, rebates paid by third-party payers such as PBMs and manufacturer-sponsored programs for consumers. So, the true manufacturer price remains somewhat elusive.
Pharmacy Pricing: Pharmacies, Consumers and Payers
Unlike most retail products where consumers buy and pay the retailer directly, for insured consumers, payment transactions for prescription drugs are facilitated by a third party, typically the PBM contracted to handle pharmacy benefits by the consumer’s payer (e.g., health insurer, employer, government program). At the point of sale, the pharmacy collects just the required cost-share from the patient and is reimbursed the remainder by the PBM based on their negotiated rates.
Average Wholesale Price (AWP)
Commercial publishers such as Thomson Micromedex and First DataBank established AWP, claiming to collect information provided by drug manufacturers and distributors. AWP has been the industry standard as a basis for payers to negotiate and reimburse pharmacies for brand-drug ingredient cost. For example, contract terms can define payment to be the lower of the usual and customary price, or AWP minus 15 percent plus a $2 fill fee.
However, criticism has plagued the reliability of AWP. A class-action lawsuit brought against First DataBank in 2006 alleged misrepresentation of average wholesale prices.2 AWP fills the role of being a standard pricing basis for brand and generic drugs between PBMs, payers and pharmacies, but does not accurately reflect an average of wholesale prices.
Maximum Allowable Cost (MAC)
Similar in function to AWP, this is the price used to reimburse pharmacies for generic and multisource drug ingredient cost. Typically, PBMs establish this cost to pay the same price regardless of manufacturer for generic drugs. This is critical to help control cost of multisource generics by incentivizing pharmacies to purchase generics from lower-cost manufacturers. The pharmacies are typically reimbursed at the lower of the usual and customary price or MAC plus a fill fee. The MAC price is analogous to discounted ingredient cost for brand drugs after applying the discount from AWP.
National Average Drug Acquisition Cost (NADAC)
NADAC is based on a monthly voluntary CMS survey of 2,500 pharmacies requesting invoice data to gather their acquisition costs and compute a public average acquisition cost (AAC), excluding rebates, price concessions and off-invoice discounts.3
Pharmacy Pricing: Payers and Manufacturers
Formularies and Rebates
One of PBMs’ major functions is to negotiate price concessions from manufacturers on behalf of insurers and consumers. This is frequently achieved through negotiations of rebates in exchange for preferred drug placement in the formulary.
The PBM establishes a formulary on behalf of payers, outlining the list of prescription drugs that will be covered under the health insurance. A formulary typically has several tiers with different cost-sharing to encourage patients to use lower-cost drugs whenever possible. For example, a basic three-tier formulary will require a $5 copay on generics, $20 copay on preferred brand drugs and $50 copay on nonpreferred brand drugs. Given how the placement of drugs on the formulary directly influences patient behavior, rebates are typically negotiated on brand prescription drugs, with the highest on interchangeable products to secure preferred tier placement on the formularies or ensure inclusion on closed formularies. A closed formulary is one where non-preferred brand drugs are excluded from coverage entirely rather than being covered at a higher copay as in an open formulary.
An Altarum report based on 2016 data found that rebates vary significantly depending on the payer. After adjusting for estimated utilization of brand-name drugs, rebates as a percent of brand-name prescription drug costs at the point of purchase is highest for Medicaid at around 61 percent and lowest for private plans at 16 percent; Medicare Part D plans achieve about 31 percent. The higher rebates in Medicaid can be attributable to market power, various government policies such as “price protection” and use of Medicare as a bargaining chip. Although CMS is prohibited from engaging in direct prescription drug price negotiations, the higher discount compared to private plans can be attributed to the ban of manufacturer coupons and stricter cost-control measures like more aggressive utilization management, multitiered and exclusionary formularies.4
To receive rebates, PBMs must submit claims to manufacturers. After the claim is examined, manufacturers will pay the rebates to PBMs, who then share it with their payer clients (e.g., health insurers, employers, government programs). The payer, in turn, shares it with all covered members in the form of lower premiums and benefit contribution rates. Since the exact amount of a rebate is often proprietary information and not directly shared with the patient filling the prescription, opponents have argued that they obscure the true prices of drugs and make cost tracking and comparison difficult for the public. They also argue that rebates place a disproportionate amount of cost burden on the patient, especially in recent years where high-cost-share plans have become increasingly common. Some health plans have begun to offer point-of-sale rebates for their plans.5 In this kind of arrangement, rather than the payer receiving rebates and using them to offset the cost of the pharmacy benefits, the rebates are paid directly to patients at the point of sale. This tends to lower the out-of-pocket costs for high utilizers of the prescription drug benefit but slightly increase premiums, as rebates are no longer available as a source of funding.
Pharmacy Pricing: Consumers and Manufacturers
Prescription Drug Coupons
Coupons are made available by manufacturers and typically distributed to patients through advertisements or physicians. As patients fill their prescription at the pharmacy, they can present the coupon to reduce their cost-share. The pharmacy then redeems the coupon with the manufacturer.
Like rebates, coupons are typically offered on brand drugs especially those with generic equivalents. A study on the top 200 drugs by spending in 2014 reported that 66 percent were branded drugs, and 68 percent of those branded drugs had coupons.6
Pharmacy Pricing: PBMs and Health Insurers
Although health insurers and self-funded employers take on the financial risk of providing health insurance to their members, they typically contract with the PBM to handle the administration of the pharmacy benefit. The main pricing models for contracts between PBMs and their clients (health insurers, employers, government programs, etc.) are spread pricing and pass-through pricing.
Spread Pricing
CMS’s guidance describes spread pricing as follows: “Spread pricing occurs when health plans contract with pharmacy benefit managers (PBMs) to manage their prescription drug benefits, and PBMs keep a portion of the amount paid to them by the health plans for prescription drugs instead of passing the full payments on to pharmacies. Thus, there is a spread between the amount that the health plan pays the PBM and the amount that the PBM reimburses the pharmacy for a beneficiary’s prescription.7
Spreads on generics are typically higher. PBMs may maintain different MAC lists, using the lower list for reimbursement to pharmacies and higher list for billing their payer clients. This spread is a source of income for PBMs, and typically replaces or supplements administrative fees.
In addition, spreads on brands can also be achieved through rebates where PBMs would retain some of the manufacturer rebates before passing them along to their payer clients. Under spread pricing, payers will usually negotiate contract terms to protect themselves. For example, there could be minimum discounts off AWP and minimum rebates that the PBM needs to deliver.
Pass-through Pricing
In pass-through pricing, the PBM charges the client the actual amount it reimburses the pharmacy, passes back all the rebates from manufacturers, and collects explicit administrative fees as income. The administrative fees under this model are typically higher than in the spread pricing model.
Effective for plan year 2010, CMS requires Medicare Part D to report pass-through prices and also deduct manufacturer rebates while reporting part D drug costs.8 Effective April 2017, CMS also requires Medicaid Fee-For-Service (FFS) programs to use the pass-through model, but this is not required for Medicaid Managed Care Organizations (MCOs).9 Some states such as Ohio have moved Medicaid MCOs away from spread pricing.
Spread Pricing vs. Pass-through Pricing
The main advantages of the pass-through model are simplicity and transparency. Payers can more easily separate and compare the drug cost and admin fees of PBMs.
Some commonly cited advantages for spread pricing include:
- Since spreads on generics are typically higher than brands, spread pricing further aligns the incentives of the PBM with the payer to push harder for generic substitution.10 However, critics have argued that PBMs might be undercutting the savings generic substitution are supposed to offer by keeping the savings themselves.11
- Pharmacy benefits are not just about negotiating drug costs and paying administrative fees to process claims. Value-added programs such as initiatives to increase medication adherence and formulary management also have an impact on total drug spend and total cost of care including medical benefit costs. Pass-through pricing encourages an emphasis on low administrative fees, even though administrative fees are likely to be higher in the pass-through model than in the spread model. To stay competitive, PBMs might have incentive to cut back on ancillary services to the detriment of patients’ long-term health and cost.12 Nevertheless, with a more explicit fee structure under pass-through pricing, some believe it is possible to encourage competition from specialized vendors who carve out certain services from PBMs.13
- CVS Caremark, one of the largest PBMs, argued that payers prefer spread pricing as “it provides stability and certainty around their drug costs when prices fluctuate up or down in the marketplace.”14
However, across the nation, the spread pricing model in Medicaid programs has been increasingly scrutinized.
- In Ohio, an audit analysis commissioned by the state based on 2017–2018 data reported that the average spread is $5.71 per prescription ($6.14 for generics and $1.85 for brands), or 8.8 percent spread relative to total amount paid by managed care plans.15
- In Indiana, Bloomberg determined that the spread was $13 per generic drug prescription in 2017.16
- In Kentucky, a report produced by the Kentucky Cabinet for Health and Family Services showed that the spread per prescription is $8.70, or 12.9 percent spread based on amounts PBMs received from Medicaid through the MCOs in 2018.17
Newer Pricing Approaches
Outcomes-based Pharmaceutical Contracts
These contracts are between the manufacturer and the payer, where reimbursement is partially based on observed outcomes. If the outcome threshold is not met, the payer gets a partial refund or increased rebate from the manufacturer. Usually the payer monitors and submits refund requests when applicable. However, it is still unclear if this has the potential to lower costs due to limitations in measuring outcomes18 and depending upon the degree of risk around which the parties are willing to contract.
Cost-plus Pricing
The goal of cost-plus pricing is to reimburse pharmacies based on their acquisition cost plus an explicit fee. Some of the benchmarks proposed are NADAC19 and predictive acquisition cost (PAC), developed by Glassbox Analytics that claimed it tracks actual acquisition cost more effectively than AWP.20 Nevertheless, this is a reference-based pricing approach to consider.
Net Cost Model
CVS announced a guarantee net cost model that guarantees average net spend per prescription after discounts and rebates for each distribution channel. Under this model, the PBM takes accountability for the impact of drug price inflation and shifts in drug mix and passes through 100 percent of rebates.21 Critics have argued this allows opaque markups on the PBM’s net cost.22
International Drug Pricing Approaches
Static and Dynamic Efficiency
Before we compare international drug pricing policies, it is important to consider the balance between future innovations and financial sustainability. Many drug pricing policies seek to address how to pay for newly released drugs while assuming that drug innovations will continue to be brought to market. But the pace of innovation itself can be strongly affected by the drug pricing policies enacted.
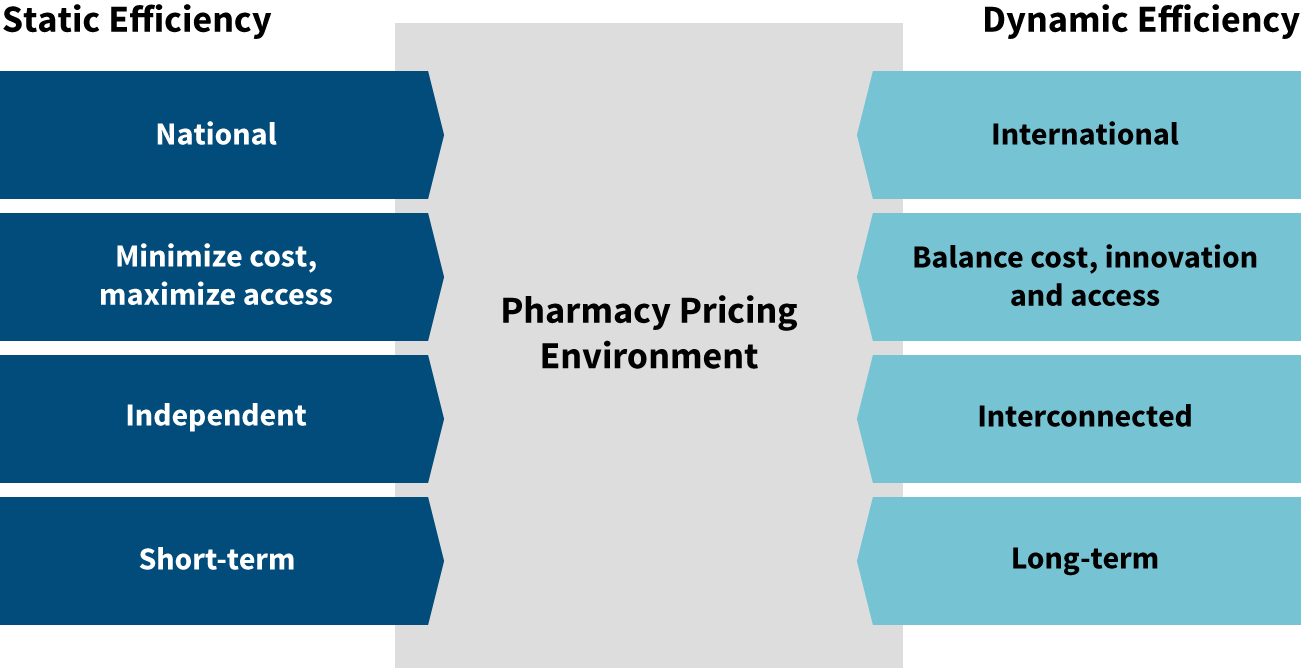
Many proposed drug pricing policies focus on static efficiency rather than dynamic efficiency (see Figure 2). Static efficiency seeks to answer the question, “How do we get drugs to the patients who need them, and how do we do it for the lowest price?” Dynamic efficiency adds innovation into the equation. Cost and access are still important, but dynamic efficiency expands the focus to ask, “How do we also maintain high levels of innovation for the long term?”
Figure 2: Static vs. Dynamic Efficiency
Australian Pharmacy Pricing23
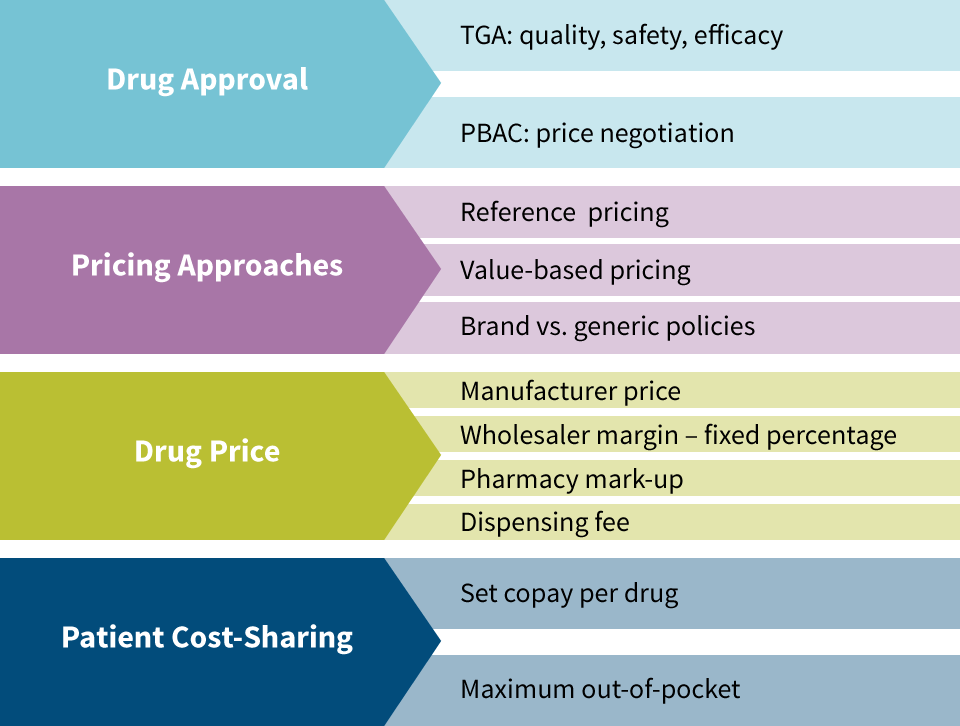
The Therapeutic Drugs Administration (TDA) approves medications in Australia based on quality, safety and efficacy. This is analogous to the Food & Drug Administration (FDA) in the United States. The Pharmaceutical Benefits Advisory Committee (PBAC) is an independent group of experts that evaluates drugs for inclusion in the Pharmaceutical Benefits Scheme (PBS), which is essentially a national formulary. Drugs not included in the PBS still need to be approved by the TDA for use in Australia, but are not included in most pricing regulation since Australia’s government is not paying for them. The PBAC is responsible for price negotiations with manufacturers.
The two primary pricing approaches for medications in Australia are value-based pricing and reference pricing (see Figure 3). Value-based Pricing is used for drugs that do not have therapeutic equivalents that are considered to be of similar safety and efficacy. They are measured based on incremental cost effectiveness ratio (ICER). For example, if a drug adds six months of quality-adjusted life compared to the next best alternative treatment and it costs $25,000, then its ICER is $50,000 per quality adjusted life year (QALY). Australia does not have an ICER cap, but it tends not to include drugs exceeding a $75,000 ICER in the PBS.
Reference pricing is applied for medicines considered to be of similar safety and efficacy as existing medications on the market. An example of this would be in the cholesterol-lowering therapeutic class that includes Lipitor and Zocor. The price of Lipitor, the first drug in this therapeutic class, is based on value-based pricing, but once Zocor was released, its price was determined using reference pricing. Under reference pricing, the government bases its reimbursement on the lowest-cost drug in the therapeutic class. If patients choose a different drug in the therapeutic class, they pay the difference in cost themselves.
Brand and generic medications are treated differently in Australia. Australia found that reference pricing was effective for brand drugs, but that their cost was higher for generics than what other nations paid for generics. Different categories now exist for single-source brand vs. multisource brand and generic medications with mandatory price reductions imposed once a generic becomes available. Incentives exist for pharmacies to dispense generics and patient cost-share increases in place for when patients use brands even though generics are available.
Once the manufacturer price is set, a wholesaler margin of 7.52 percent is applied (for drugs under $1,000 price). Then a formula-driven pharmacy markup is applied in the form of the administration, handling and infrastructure fee. Next a dispensing fee is applied ($6.76 in 2014) and adjusted annually. Patient cost-sharing consists of a $36.90 copay (in 2014) and a family-level out-of-pocket (OOP) maximum of $1,421.20 annually. After reaching the family OOP maximum, the per-prescription copay becomes $6. Lower copays and a lower family OOP maximum apply for the aged, disabled, unemployed and lower-income earners.
Figure 3: Australian Pharmacy Pricing
When considering the example of Australian pharmacy pricing approaches, it is helpful to learn from what has worked well in that static-efficiency context while carefully evaluating the dynamic-efficiency implications of applying one or several of those pricing approaches in the United States. Not only is affordable access to current medications critical for patients, but the continued innovation that develops new medications for future affordable use is also important for current and future patients.
Conclusion
Prescription drug pricing in both the United States and other countries has risen rapidly over the past two decades. As new specialty medications with very high costs become available, it will become essential for every country to determine how to afford those drugs and the benefits they often provide. PBMs currently sit between pharmaceutical manufacturers and payers in the United States, which positions them well to administer value-based contracts that could tie the reimbursement for drug costs to the benefits they provide.
Actuaries are also well-positioned to assist in developing and implementing new payment methods based on their deep understanding of risks and medical costs, as well as their knowledge of the current pharmaceutical pricing landscape. New prescription drugs have the possibility to be a huge benefit to patients, but their success will depend on the ability to align the incentives of manufacturers and payers to pay for value that ultimately improves patients’ lives. Actuaries can be instrumental in bringing that alignment to fruition. Let’s seize this opportunity.
References:
- 1. Prescription Drug Pricing in the Private Sector. Congressional Budget Office, January 1, 2007 (accessed April 14, 2017). ↩
- 2. Martinez, Barbara. How Quiet Moves by a Publisher Sway Billions in Drug Spending. The Wall Street Journal, October 6, 2006. ↩
- 3. Pierce, Kevin, and Andrea Sheldon. NADAC-plus: An Emerging Paradigm in Pharmacy Pricing? Milliman, November 2018. ↩
- 4. Roehrig, Charles. The Impact of Prescription Drug Rebates on Health Plans and Consumers. Altarum Institute, April 2018. ↩
- 5. UnitedHealthcare Implements Point-of-sale Discounts for Eligible Plan Participants. United Healthcare, April 16, 2018 (accessed April 4, 2020). ↩
- 6. Van Nuys, Karen, Geoffrey Joyce, Rocio Riberio, and Dana Goldman. A Perspective on Prescription Drug Coupons. Leonard D Shaeffer Center for Health Policy and Economics, February 2018. ↩
- 7. CMS Issues New Guidance Addressing Spread Pricing in Medicaid, Ensures Pharmacy Benefit Managers Are not Up-charging Taxpayers. Centers for Medicare & Medicaid Services, May 15, 2019 (accessed August 4, 2019). ↩
- 8. Roe, Kathryn, Thomas Bixby, and Stephanie Vasconcello. CMS requires Medicare Part D Cost Transparency, Expands Beneficiary Protections and Tightens SNP Rules. Lexology, January 28, 2009. ↩
- 9. HPC DataPoints, Issue 12: Cracking Open the Black Box of Pharmacy Benefit Managers. Massachusetts Health Policy Commission (accessed August 4, 2019). ↩
- 10. Snook, Thomas, and Troy Filipek. Pharmacy Benefit Management: Pros and Cons of Various Approaches. Milliman, May 2011. ↩
- 11. Langreth, Robert, David Ingold, and Jackie Gu. The Secret Drug Pricing System Middlemen Use to Rake in Millions. Bloomberg, September 11, 2018 (accessed August 4, 2019). ↩
- 12. Supra note 10. ↩
- 13. Bai, Ge, Mariana P. Socal, Michael Sharp, and Eric S. Pachman. Medicaid Managed Care Programs’ Contracts for Generic Drugs Are Inefficient. Health Affairs, May 1, 2019 (accessed August 4, 2019). ↩
- 14. CVS Health Statement on PA Auditor General’s Report on PBMs. CVS Health, December 11, 2018, (accessed August 4, 2019). ↩
- 15. Auditor’s Report: Pharmacy Benefit Managers Take Fees of 31% on Generic Drugs Worth $208M in One-Year Period. Ohio Auditor of State, August 16, 2018 (accessed August 4, 2019). ↩
- 16. Supra note 11. ↩
- 17. Kentucky Cabinet for Health and Family Services, Office of Health Data Analytics, and Department for Medicaid Services. Medicaid Pharmacy Pricing: Opening the Black Box. Kentucky Cabinet for Health and Family Services, February 19, 2019 (accessed August 4, 2019). ↩
- 18. Seeley, Elizabeth, and Aaron S. Kesselheim. Outcomes-Based Pharmaceutical Contracts: An Answer to High U.S. Drug Spending? The Commonwealth Fund, September 27, 2017, (accessed August 4, 2019). ↩
- 19. Supra note 3. ↩
- 20. What Is PAC. Glassbox Analytics (accessed April 4, 2020). ↩
- 21. Rice, Derica. Guaranteed Net Cost: A Pharmacy Benefit Pricing Model Focused on Net Plan Cost. CVS Health, December 5, 2018 (accessed August 4, 2019). ↩
- 22. Abrams, Lawrence W. The Problem with CVS’s “Guaranteed Net Cost” PBM Business Model. Nu Retail, December 17, 2018 (accessed August 4, 2019). ↩
- 23. Babar, Zaheer-Ud-Din. 2015. Pharmaceutical Prices in the 21st Century. Switzerland: Springer International Publishing. ↩
Copyright © 2020 by the Society of Actuaries, Chicago, Illinois.